Letter to the Editor

Freedom of Information requests obtained by the Simcoe County Greenbelt Coalition show that the province is not being upfront regarding the Bradford Bypass.

February 20, 2023 - Simcoe County

Letter to editor response to article “No timeline yet for controversial Bradford Bypass project.”

Can we stop pretending that the province doesn’t have answers about its controversial Bradford Bypass project and instead recognize the misinformation for what it is? In the article quoted, the journalist outlines that the project doesn’t have a timeline yet. That is simply not true. They have a timeline but chose not to share it.

Freedom of Information requests by the Simcoe County Greenbelt Coalition show that the province is working on a timeframe of completion no earlier than 2032. These are documents straight from the MTO. The timeframe was corroborated and reported in The Toronto Star and The Narwhal.

It is shameful that instead of answering council’s questions directly, MTO decided that they’d rather not outline that it could be at least a decade before this highway is ready for use, if it even comes.

To those of us who follow this closely, the misinformation and hiding of facts is par for the course. What else haven’t government officials and consultants been upfront about?

Well for starters, the cost.

Infographic showing how much the cost of the Bradford Bypass has ballooned, and what that money could be spent on instead. Credit Simcoe County Greenbelt Coalition.

In its recent report of government expenditures, the Financial Accountability Office of Ontario notes that the government is vastly under-spending in a number of areas.

We believe that these areas, including health, education, and children’s services, are important and that they should be priorities.

The Auditor General reported that this 16 km highway could cost a staggering $2-4 billion – that’s according to MTO’s own calculations. That’s a whopping $125,000,000 per kilometer you and I will pay for the Bypass. That’s using the lower figure. Use the upper end of their estimates (when’s the last time large construction projects come in on budget?) and you get a figure of a quarter billion dollars, yes $250 million, per kilometer that taxpayers are on the hook for.

We have the internal documents that show the government knew of this new cost in 2021, prior to them ramming ahead with it. Even so, there was no effort to inform the public that the project’s price tag had ballooned at least 300 percent from the $800,000 estimate project staff and Minister Caroline Mulroney were touting.

This project is still almost a decade away before it’s completed. How much more of our tax dollars is this government going to waste on it?

What else have they not been upfront about?

The size of the highway.

We knew there was talk about potentially widening the highway to six lanes. But yet again this seems to be part of an effort to minimize impacts and mislead the public. We know that in fact this may be an eight lane highway – double the size.

This means double the loss of Greenbelt, double the loss of wetlands, double the air pollution and double the noise pollution. Again, this was corroborated and reported in the Toronto Star and Narwhal investigations.

Map showing locations of highways that the Ford government plans to build, and the impact they would have on the Greenbelt and on farmland. Credit Simcoe County Greenbelt Coalition.

There are 3 highways in the pipeline for the Greater Golden Horseshoe Area of Ontario. All of them will significantly impact the Greenbelt, as well as prime farmland.

So instead of the headline making it sound like there’s no information available, let’s call it for what it is – misinformation,obstruction, and wasteful use of taxpayers money by this government. Because, like us, they know that in a time when people are wanting solutions – better healthcare and good use of public funds – communicating the truth of the matter would just expose this highway as another boondoggle – a gas plant scandal in our own backyard.

The Whale

What Would Roosevelt Think? (Who knows, he's dead.)

This is a cross-post from our new Substack letter, The Whale. For The Whale we have four writers who will be posting respective weeks. Posts will reflect their unique takes on all things environmental, be relatively short and sweet, and usually include links to further reading.

If you’d like to check it out you can find it here, or you can read on through this piece and towards the end there’s an option to subscribe.

The Whale Logo-1(1)

December 14, 2022 - Simcoe County

For all the current antagonism between Ontario’s Progressive Conservative Party and environmentalists, you may be surprised to learn that both share roots more interwoven than is commonly known.

– A short essay on conservatism, conservationism, environmentalism and why all of the above are important. –

As a long-time student of nearly everything environmental (I did both my undergrad and graduate degrees in the environmental field) one of the first things I learned was that modern environmentalism has its roots in the conservation movement.

Portrait of Theodore Roosevelt.

A key figure of this movement was the 26th President of the United States, Theodor Roosevelt, a Republican, who, while a progressive on that side of the political spectrum, was, nevertheless, not a bleeding heart granola cruncher. (I love crunchy granola, by the way. It’s the worst when it’s soft.) 

Roosevelt, in addition to being rich and a soldier and historian and a writer and a president, was also a naturalist. (The clothed sort as far as I know.) When he was eight he obtained a seal’s skull that washed up in New York, and over the years he gained additional disparate specimens, with which he created what became, in 1867, the Roosevelt Museum of Natural History.

There’s a spark of curiosity at play here, an inquisitiveness that drove him to broaden and deepen his understanding of the natural world. This openness to creating new ways of understanding and engaging with the world led to the creation of the U.S. national parks system, the first of its kind in the world.

Photo by Ansel Adams, titled The Teton Range and the Snake River.

Protecting these parks required a process, of course, a method of determining which lands should be protected and the form that protection should take. This process, the identification of something valuable and worthy of protection, is, or at least was, pretty central to conservatism. There is some degree of effort involved with maintaining something over time, after all (everything decays in time, weather worn pyramids and allusion to Ozymandias here) and so the process of deciding whether the value of doing so is worth it is important.

One can quibble, I suppose, about the different types of conservatism, whether traditional or fiscal or social or some other slice of the pie, but the central premise of each is the same as what’s outlined above, that determination of something which it is desirable to maintain, to hold on to and preserve.

For the traditional conservative this may be practices that characterize their culture; for the fiscal conservative it’s likely to be keeping spending low…for Roosevelt his conservatism was exemplified, at least in good part, by his belief that places like Yellowstone National Park are worth keeping.

A detailed pictorial map of Yellowstone National Park, by Henry Wellge.

But here’s the kicker, the good is deemed worthy of protecting based upon some degree of knowledge of it, an understanding of the utility and value of it. At least, it seems to me, it should be based on such.

Conservatism, according to this, is rooted in identifying things that are believed to be important and then, accordingly, the protection or preservation of those things. 

The way that the identification of what is important happens is crucial. It’s the fond to the pan sauce, to borrow something a better chef than me might say. Using a faulty process for this or simply basing it on one’s opinion, which may not be shared by others, is bound to wind up in tension and disagreement. (We’ve all got some weird ideas that set us apart, right? I like to listen to jazz when I’m making dinner but my wife and kids will have nothing to do with it.)

So, the point I’m making is that the process is important in determining the quality of the outcome. And, the quality of the process rests upon the accuracy of the information it uses. Bad information and you wind up with an error riddled outcome – the Windows Vista of reasoning.

To bring this all back to environmentalism, the way we navigate our world as a species is a process of information gathering, analysis, and consequent action. Environmentalism extends this process to the natural world because it is the most basic building block of life, including what we require for our survival as a species.

But the processes we use to determine what to protect and conserve are being broken. Environmental regulations are being cast aside or seen as simply perfunctory. Ecological systems, which are fundamentally interconnected (think of the organs within the body and how they work together to create a greater whole) are seen as dumb components that can be swapped out and replaced. Nature, in other words, is seen as a sort of technology.

The sad irony of this is that, in this province at least, much of the hammer swinging is being done by those who claim the mantle of conservatism, by those who, given the roots of the political ideology they appeal to votes from, should be deeply concerned with identifying that which is valuable for us as a society to hold on to.

There is the old saying, though, that I think indicates what’s happened, and is happening, here in Ontario. Ours is a government that knows the price of everything and the value of nothing. When all you want is power for the sake of power you have no compass any longer. You shift your values to align with whatever you think will get you what you want. That isn’t conservatism, it’s greed and opportunism.

About the Author

Picture of Adam Ballah

Adam Ballah

Adam has worked with SCGC since, almost, its conception. He holds a Masters Degree in Environmental Studies from York University, and is deeply interested (and concerned) with intersections between risk, vulnerability, and security when it comes to climate impacts.

Related Content

This illustration image of Poilievre combines a frame from a now notorious engagement where he belittled a journalist while eating an apple, with a photo of a forest fire added as a backdrop, in place of the orchard.

Issue In Brief: Understanding the Carbon Tax

The debate around the carbon tax frequently misses its broader economic and environmental benefits. By effectively addressing the externality of carbon emissions, the carbon tax stands as a critical component of Canada’s strategy to combat climate change and promote sustainable growth. Clear communication and understanding of the policy’s benefits, including the progressive rebate program, are vital in navigating public concerns and fostering support for this essential environmental initiative.

Read More »

Community Polls

Every month we send out our newsletter, in which we include a poll, as well as results from the previous month’s poll. Open polls, as well as completed ones, are below.

Subscribe to our newsletter to make sure you don’t miss out!

Read More »

In Conversation: Catherine McKenna

Join us for an hour-long conversation, including a question and answer session, that will cover topics including the current state of Canada’s efforts to reduce carbon emissions, how we can think about progress to combat climate change in the presence of political uncertainty, and the role of women in public life, particularly in an era that seems to be one of increasingly toxic discourse, including around gender.

Read More »

Community supported, advocacy for a safe and secure future.

Governments have failed to act to protect our communities and the futures of our children and grandchildren, and they continue to treat our environment as if it’s incidental to life, rather than a foundation for it.

We need strong community organizations to fight for our future, now more than ever.

Please consider donating to support our work. It’s people like you who make us possible.

Subscribe to Our Newsletter

We send out a once-monthly newsletter full of information on what’s happening in Simcoe County and beyond, including information on how you can take action to protect the health of your community.

Analysis: More Homes Built Faster Act

Changes that put people and their property at risk.

Context

Recent moves by Ontario’s government seem likely to create conditions for a number of crises in the next few decades that, when combined, are greater than the sum of their parts. This is what’s known as a “polycrisis”, a term popularized by economic historian Adam Tooze.

Cost of living concerns, including housing, food, and energy prices, pressure on natural resources and pollution, congestion and accessibility in an economy increasingly reliant on just-in-time delivery standards, a growing infrastructure deficit combined with a lack of attention at the highest levels of government to building more efficient communities are just some of the issues coming to a head. Furthermore, the growing reality of a climate supportive regulatory framework internationally also threatens to leave behind an Ontario led by a government that continues to regress on climate action.

Chart by the IMF showing the impact that delayed climate policy is likely to have on global GDP. Credit IMF.

This chart from the International Monetary Fund (IMF) shows the impact to GDP of delayed climate action.

The Ontario government has shown an almost antagonistic stance towards decarbonization, which places it offside both in the effort to reduce GHG pollution and in the emerging low-carbon economy.

Ironically, the government’s often stated goal of providing certainty in the market, though this tends to be directed mostly at the housing market, is undercut by its capricious decision to slash clean energy programs.

It’s widely understood that Ontario is in the midst of an affordable housing crisis. According to the province’s Housing Affordability Task Force the price of housing in Ontario has nearly tripled over the past 10 years, from $329,000 in 2011 to $923,000 in 2021, putting home ownership out of reach for many. This is an increase in the price of housing of 180%. Over the same period of time the average income in Ontario has grown by just 38%.

It’s worth noting that this government, which presumably struck the Housing Affordability Task Force for the purpose of providing solutions to the affordability crisis, recently threatened to override with the Notwithstanding Clause the labour rights of education workers seeking wage increases in line with inflation. This would have maintained downward pressure on the income of 10s of thousands of Ontarians, making it impossible for them to participate in the housing market.

Upward pressure on house prices was exacerbated by the COVID-19 pandemic, when many more wealthy property owners situated in urban areas sought to relocate to rural areas, but pressure has been building outside of that time period as well, and it is argued that this is due in large part to too few homes being built, causing a lack of supply in the market.

The Smart Prosperity Institute, who, it should be noted, is a prominent proponent of the lack of supply argument, released a report in October of 2021, almost exactly a year prior to introduction of the Act, stating that Ontario needs to build 1 million new homes over the next 10 years. This figure is extrapolated from Ministry of Finance estimates for population growth, of 2.27 million more people in Ontario, through that same period. This calculation assumes an average household size of slightly less than 2.5 people.

Proposed Changes

Introduced October 25, 2022, the More Homes Built Faster Act (the Act) is meant to achieve the goal, the government claims, of facilitating construction of 1.5 million new homes in Ontario by 2031. This is an omnibus bill, which includes changes to nine different acts, including:

  • the City of Toronto Act, 
  • the Conservation Authorities Act, 
  • the Development Charges Act, 
  • the Municipal Act, 
  • the New Home Construction Licensing Act, 
  • the Ontario Heritage Act, 
  • the Ontario Land Tribunal Act, 
  • the Ontario Underground Infrastructure Notification System Act, 
  • the Planning Act, and
  • the Supporting Growth and Housing in York and Durham Regions Act.

In the press release announcing the Act the government states that it will be seeking input on integrating the Provincial Policy Statement (PPS) as well as the Growth Plan into a “single, provincewide planning policy document.” While this is not part of the Act, it has been posted to the Environmental Registry for a period of public comment that closes December 30th.

Municipal Planning

The Act proposes an upper limit on the percentage of units that can be required to be affordable, at 5%, with a maximum number of years that the unit must remain affordable at 25. Putting this into context, the City of Toronto recently proposed inclusionary zoning that requires 22% of units to be affordable, with a maintenance at affordable levels of 99 years.

Units considered to be affordable are generally defined as those costing no more than 80% of the average cost of units, whether the price to purchase or rent it, in the year said unit is rented or sold. This begs the question of whether units already categorized as affordable are included in this calculation. If so, the lowering of the maximum allowed could place upward pressure on prices, including those considered affordable, due to the lower, more more diluted number of units built to meet that definition, as well as the increasing cost of market rate housing comprising the averaged figure.

In other words, this lower maximum may have the effect of diluting the number of affordable units included in the calculation, increasing the amount of what classifies as affordable.

All upper tier municipalities in the GTA, as well as Waterloo and Simcoe, will no longer have approval authority for Official Plans or their Amendments under the Planning Act. Such approvals could be appealed by residents, community organizations, as well as developers, but with their removal from the process the final approval authority goes to the Minister, where there is no possibility of appeal.

Removing planning responsibility from Regions and Simcoe County places it with, in the case of Simcoe, municipalities that are often quite small with few dedicated and knowledgeable planning or legal staff. This, paired with the potential reduction of revenue due to the changes in DCs (outlined below), as well as the potential for costs awarded by the Ontario Land Tribunal (OLT), may create a dynamic of uncertainty with respect to expertise, as well as concern regarding exposure to costs, on the part of municipalities challenging or attempting to guide development applications. This seems likely to have a chilling effect on municipal engagement in planning our communities on behalf of the public’s interest.

Affordable housing, attainable housing (for which the government says a definitional category will come in future regulation), and inclusionary zoning units will be exempt from Development Charges (DCs), Community Benefit Charges (CBCs), and parkland dedication requirements.

Site plan control allows municipalities to require elements, such as landscaping with trees and rain catchment features, that provide cooling, reducing reliance on air conditioners, as well as water filtration and absorption.

These are features that help mitigate the impacts of climate change, improve the quality of life for residents, and lower costs for municipalities.

All aspects of site plan control, which is a tool municipalities use to “evaluate certain site elements, such as walkways, parking areas, landscaping or exterior design on a parcel of land where development is proposed”, will be removed from all proposals that are less than 10 units. Furthermore, municipalities will be limited generally in their ability to determine architectural and landscape design details.

Limiting site plan authority is likely to result in municipalities being unable to implement climate friendly standards, such as Toronto’s Green Standard (TGS). The TGS is meant to help Toronto achieve community wide net zero carbon emissions by 2040, by “[limiting] GHG emissions from newly constructed buildings, providing electric vehicle charging in parking spaces and enhancing stormwater management and landscape requirements.” Since implemented 12 years ago the TGS has reduced Toronto’s GHG emissions by the equivalent of 52,000 cars worth every year. The landscaping component of site plan control, for example, can require trees, which give shade that helps reduce the need for air conditioning, as well as sequester carbon dioxide. Rain water gardens can help reduce flooding and improve water quality. Electric vehicle charging stations can also be mandated as part of site plan control.

“As of right” zoning would be implemented province-wide in settlement areas zoned residential with full water and sewage servicing, allowing for up to 3 units per lot with no restriction on unit size. Municipalities would be prohibited from imposing DCs, parkland, or in lieu requirements or requiring more than one parking space per additional unit.

Parks

The amount of land that can be conveyed or paid in lieu to the municipality to satisfy parkland requirements is capped at 10% for smaller developments (under 5ha) and 15% for developments larger than 5ha.

What constitutes parkland has been broadened to include privately owned accessible spaces, as well as open spaces on top of structures.

Development Charges

Any Development Charge (DC) rate increase will now be phased in over 5 years.

The historical service level for capital costs, which helps determine the rate charged, is extended from 10 to 15 years.

The effect of extending the period of time by which the rate is calculate is that it smooths the curve and, by reflecting more of the past than the present, seems likely to reduce the rate slightly.

Interest paid on DCs for rental, institutional, and non-profit housing will be capped at prime plus 1%. There will be additional inducements for purpose built rental, including a discount, freeze and deferral on DC payment over five years.

The cost of studies, including background studies, will no longer be eligible for recovery through DCs.

Municipalities will be required to spend at least 60% of DC reserve balance on priority infrastructure at the start of each year.

The ERO notice states that this is for “water, wastewater, and roads.” There is no mention of transit or other infrastructure types, except that a “regulation making authority would be provided to prescribe additional priority services…in the future.”

Transit

Municipalities will need to update zoning to set minimum heights and densities in major transit stations areas (MTSAs). Municipalities would be required to update zoning laws to allow as-of-right zoning for this increased density within one year of passage of the MTSA or Protected MTSA (PMTSA).

Capital costs that are eligible to be recovered through DCs will be determined by a longer period of time, with the historical service level extended to 15 years rather than 10 years. This would not apply to transit, however.

The separation between using a historical record for general DC rates of 15 years, from the current 10 years, and that used for transit, which remains at 10 years, has the same effect, noted above, of smoothing out and likely lowering the rate calculated over the longer time period.

In other words, car oriented service levels, and the capital costs municipalities are able to recover for them, are likely to be reduce vis transit service levels, creating further incentive for car infrastructure and sprawl at the expense of transit.

Car oriented infrastructure is far less efficient that mass transit and walkable communities. According to recent figures from the Financial Accountability Office, Ontario municipalities have an infrastructure deficit of $52 billion. Being smarter about how we use space in urban areas can increase efficiency and help reduce this backlog. Further expanding car oriented development, however, seems likely to only exacerbate the problem and further stress municipal capacity.

Infographic showing how much more space is required for cars, vs buses and metros for urban transportation. Credit: International Association of Public Transport
Credit: International Association of Public Transport

Conservation Authorities

The Act will repeal 36 regulations that allow Conservation Authorities (CAs) to oversee and regulate development. As a result permits from CAs will no longer be required for development authorized under the Planning Act within (formerly) regulated areas, including wetlands.

The changes mean that CA responsibilities will be narrowed to focus strictly on natural hazards and flooding, and that they will no longer be able to consider “pollution” and “conservation of land” when assessing a proposed development.

CAs are currently responsible for mitigating natural hazards and flooding risk, but, in areas such as flood risk mapping, some CAs have available mapping while others, including the NVCA and LSRCA, do not. This may have to do with a lack of resources, but narrowing their focus in this regard may not cause them to be more effective in producing results so long as municipalities, which provide funding to CAs, are constrained in their revenue generation. Municipal revenue generation may, in fact, be further constrained by the changes proposed in this Act.

Conservation of land is mentioned numerous times in the Conservation Act but never explicitly defined. Where this relates most closely to the current mandate of CAs is with respect to their ability to protect, manage and restore woodlands, wetlands, and natural habitat by placing such areas off limits to development or activity that might otherwise negatively impact them.

It’s noteworthy that when the current core mandate of CAs is considered, that they “undertake watershed-based programs to protect people and property from flooding and other natural hazards, and to conserve natural resources for economic, social and environmental benefits”, the removal of the mandate outside of the strict flooding and natural hazard responsibilities seems to either place the utility of “natural resources for economic, social, and environmental benefits” elsewhere, presumably with the development sector, or to simply negate it altogether.

One consequence of removing the conservation of land role of CAs is that, in addition maintain the integrity of natural systems they also provide recreational opportunities and programs, providing areas where the public can experience nature and partake in programming aimed at enhancing our understanding of and connection to the important roles that natural systems play in our society and economy. According to Conservation Ontario an average of 35% of CA revenue comes from fees generated through delivery of these programs, as well as other activities, such as fees from developers for permits, that also seem likely to be cut. For some CAs, such as the Grand River Conservation Authority, self generated fees make up 50% of their yearly revenue.

CAs will also be required to issue development permits for projects authorized under the province’s Community Infrastructure and Housing Accelerator, a newly created power very similar to a MZO, which grants the Minister authority to make an order, at the request of a single or lower tier municipality, expediting zoning approval so that a development may proceed. This only applies outside of the Greenbelt area.

The changes to the CAs are meant to reduce the “financial burden on developers and landowners making development-related applications and seeking permits”, a leaked document obtained by The Narwal says.

Furthermore, CAs, currently required to complete a conservation strategy and land inventory under O. Reg. 686/21, will be now required to include in that inventory a category of lands that could support housing development. This detail, which is not included in the Act, is noted on the ERO posting and outlines how such lands would be identified by consideration of “the current zoning, and the extent to which the parcel or portions of the parcel may augment natural heritage land or integrate with provincially or municipally owned land or publicly accessible lands and trails.”

Ironically, as the Narwal points out, the government itself notes in the leaked cabinet document that “the federal Parliamentary Budget Office has credited Ontario’s floodplain and hazard management policies and programs, including the role of [conservation authorities], with keeping losses associated with flooding in Ontario lower than losses seen in other Canadian provinces.”

Further, highlighting the value of what CAs do, the Insurance Bureau of Canada just released research finding that “the disclosure of natural hazard and climate risk is urgently needed in the Canadian housing market because of the increasing frequency and severity of natural disasters.” The Bureau is calling for a “climate score” metric that would indicate the exposure of a property to the risk of climate impacts.

Wetlands

Major changes will happen with how Provincially Significant Wetlands (PSWs) are assessed. Currently wetlands, when assessed (not all are), are given a score based on criteria including biological, social, hydrological, and special features. Wetlands that score above 600 combined, or above 200 on either the biological or special features component, are categorized as PSWs.

Smaller wetlands can no longer be assessed as an interconnected complex. This means that only individual wetlands at least 4 hectares in size will be assessed.

Wetlands smaller than 4 hectares were not allowed to be assessed under the previous scoring system, but they could be complexed together with other nearby smaller wetlands as a system of wetlands. This was crucial for protecting habitat for species such as the Jefferson Salamander, which prefers smaller wetlands of roughly .5 ha.

Points can no longer be awarded based on the presence of SAR. This means that wetlands that have been scored as PSWs due to the presence of SAR will now be downgraded, which means that they can be developed upon.

MNR biologists used to be responsible for rating wetlands. This responsibility is being removed and placed with municipalities.

The government plans to use offsetting so that if a wetland is built upon, a wetland elsewhere will be created. The goal is for there to be a “net gain” in natural heritage features this way. Developers who build on wetlands would pay into a fund, which would then be used to ‘compensate’ elsewhere for the loss of that wetland.

The approach misunderstands how ecosystems work, assuming them to be interchangeable blocks that can be swapped out without any loss in system function. The language of the discussion paper seems to acknowledge this, stating that “the result of an offsetting policy should be a net gain in natural heritage area and/or function.” The simple focus on natural heritage area through the use of “or” allows for the exclusion of function as a net gain requirement.

In Southern Ontario an estimated 72% of wetlands that were originally present have been lost. Loss in particularly acute in southwestern Ontario, where about 85% of wetlands have been converted to other uses. Source: Ontario Biodiversity Council

In Southern Ontario an estimated 72% of wetlands that were originally present have been lost.

Loss in particularly acute in southwestern Ontario, where about 85% of wetlands have been converted to other uses.

Source: Ontario Biodiversity Council

Public Participation

Third parties, such as residents, community organizations, and nonprofits, will no longer be allowed to appeal any Planning Act decisions. This means that only the applicant, municipality, certain public bodies, such as Indigenous communities or utility providers that have participated in the development process, and the Minister will be able to appeal decisions to the Ontario Land Tribunal.

Public meetings for subdivision plans will no longer be required.

Public participation in planning is already at a disadvantage. Members of the public have to use their own time and energy, on top of work and family duties, to participate. Developers, on other hand, are paid for their time, have access to the expertise of highly paid lawyers and planners, and can leverage relationships built with elected representatives and staff over long periods of time.

Some will argue that reducing public participation in planning will help to counter NIMBYs. Given the existing barriers it seems just as likely that wealthy and connected NIMBYs will continue to be able to prevent development they don’t desire from happening, while those with less access, namely more marginalized communities, will be left without recourse.

Additional Comments

The leaked cabinet document also provided an overview of how the Act is expected to be received by the public and other stakeholders highlights opposition is expected, noting:

“Reaction from agricultural and environmental sectors likely to be strongly negative due to potential impacts on environmental protection, increased loss and fragmentation of prime agricultural lands, subsequent negative impacts to the agri-food sector, and increased allocations of land for housing and other urban uses.”

It goes on to state that the changes are welcomed by developers:

“[The] Development sector would support simplification of the policy framework with a goal to increase housing supply, but would be concerned if changes result in delays to development applications.”

It’s worth noting that increasing housing supply can be accomplished in the Greater Toronto Hamilton Area (GTHA) within the currently designated greenlands area. Greenfield is defined by the province as “lands within settlement areas (not including rural settlements) but outside of delineated built-up areas that have been designated in an official plan for development”.

Unused greenfield in the GTHA is estimated to be 350 square kilometers.

Statistics Canada calculates the average density of Census Metropolitan Areas (CMAs) in Canada to be 5,385 people per square kilometer. (The downtown CMA with the highest density is Vancouver, with 18,837 residents per square kilometer. Toronto has 16,608 per square kilometer. Barrie has 2,389.) Factoring these two metrics provides a potential for 1,884,750 residents in currently designated greenfield in the GTHA.

While it is unlikely that the entirety of the unused greenfield would be developed to the density of Toronto’s downtown core, which would see 5,812,800 people accommodated, a combination of increasing densification as missing middle in currently developed areas with a similar style of development in the greenfield would allow for Ontario to easily meet projected population growth for the entire province, and this in the GTHA alone. Including development of greenfield outside of the GTHA only makes this easier.

Ultimately this makes clear that no additional land is needed to meet housing demand for the foreseeable future, and that moves to do so are the result of political choices made rather than necessity.

Affordability

The contrast between the stated goal of addressing housing affordability, the limitations placed on municipalities ability to ensure affordable housing is provided through inclusionary zoning, the hard line it is taking on wage growth in the public sector while accepting the concerns expressed by the Housing Affordability Task Force that a key part of the problem is the growing gap between house prices and income, in concert with the leaked cabinet document that notes the likelihood of widespread opposition from environmental, First Nation, and community groups indicates that this is a government that is compromised. While progressing with somewhat sound, evidence-based or well-reasoned policy in some areas, it is clear given the extent and magnitude of changes proposed here, and the degree to which they conflict with guidance and policy previously developed, that this is a government highly exposed to influence from a relatively narrow set of special interests.

This is concerning given the increasing risks that Ontario will face in a rapidly changing and uncertain world, in which costs will to a great extent be determined by how well communities and society is prepared to respond and recover prior to events and impacts occurring.

The fact that as a population grows stresses AND reliance increase on natural resources, for example, and that these resources, including a healthy Ontario-based agriculture system that is able to provide food to reduce potential shocks and price fragility associated with international supply chains, seems to be completely missing from the province’s assessment of what is needed for Ontario’s future.

The loss of farmland in Ontario at current rates may bring food sovereignty from the current ratio of roughly 2/1 food production potential to people, down to nearly 1/1 by 2046, and a loss of food sovereignty by 2055.1Food supply is calculated as the amount of people that the food an acre of farmland can produce can support, which is derived from a study by Cassidy et all (2013), titled Redefining agricultural yields: from tonnes to people nourished per hectare, and equals 2.18 people per acre. Total farmland in Ontario is calculated by MPAC at 14,154,981 acres in 2021. The rate of farmland loss is calculated by Statistics Canada’s Census of Agriculture (2021) at 116,435 acres per year.

It should be noted that climate impacts to Ontario’s agriculture productivity are anticipated to be a mix of positives and negatives. Ontario is likely to experience longer growing seasons, which will boost productivity. However there will be more droughts, pest concerns, storm damage, as well, all of which increase the instability of the system. For the chart below we maintained a business as usual scenario, leaving out the likely increase in farmland loss that will result from the changes proposed by this government, to reflect both the possible increase in productivity as well as the increased instability. To our mind instability – specifically the risk of “Black Swan” events that increased uncertainty carries – outweighs any benefit Ontario may experience. (And again, this government has stated that certainty is a goal.)

The value derived from building in a way that enhances resilience through access to a multitude of opportunities, including transportation options that enable residents to get to places of employment cheaply and reliably, or varied and diverse social connections, which greatly enhance creativity and innovation, or the co-benefits to healthcare that can be realized from being able to walk to nearby amenities, and this is to name just a few, also seems to be missing from this government’s consideration. These are the ingredients that will combine to create success in the future, but they are for the most part absent or mentioned only as window dressing.

These contradictions and counterproductive positions in the province’s policy with respect to housing and the environment illustrate the value of overarching planning.

Michael Tolensky, chief financial and operating officer at the Toronto Region Conservation Authority, told The Narwhal in a written statement. “Legislation permitting developers to profit at the expense of long-term public safety and community resiliency is purposefully shortsighted.”

Related Content

Community Polls

Every month we send out our newsletter, in which we include a poll, as well as results from the previous month’s poll. Open polls, as well as completed ones, are below.

Subscribe to our newsletter to make sure you don’t miss out!

Read More »

In Conversation: Catherine McKenna

Join us for an hour-long conversation, including a question and answer session, that will cover topics including the current state of Canada’s efforts to reduce carbon emissions, how we can think about progress to combat climate change in the presence of political uncertainty, and the role of women in public life, particularly in an era that seems to be one of increasingly toxic discourse, including around gender.

Read More »

Community supported, advocacy for a safe and secure future.

Governments have failed to act to protect our communities and the futures of our children and grandchildren, and they continue to treat our environment as if it’s incidental to life, rather than a foundation for it.

We need strong community organizations to fight for our future, now more than ever.

Please consider donating to support our work. It’s people like you who make us possible.

Subscribe to Our Newsletter

We send out a once-monthly newsletter full of information on what’s happening in Simcoe County and beyond, including information on how you can take action to protect the health of your community.

The impact of new highways on the Greenbelt is likely to be felt far and wide, our mapping shows.

Highway Construction and Aggregate Mining in the Greenbelt

Aggregate Mining in the Greenbelt

New research released by Gravel Watch Ontario, Simcoe County Greenbelt Coalition and Environmental Defence suggest that massive amounts of aggregates for the Bradford Bypass and 413 highways will come from pits in the 905 and the Greenbelt.

Mining these aggregates will have serious impacts on nearby communities and must be addressed in environmental reviews of the proposed highways.

According to the research, building the two highways will require approximately 3 million tonnes of new aggregate, and will increase truck traffic within affected communities by over 130,000 truckloads during construction.

The analysis shows that several communities within the 905 region are more at risk of becoming the future source of the highways’ aggregate because of their proximity to the proposed routes of the highways, the amount of potential aggregate resources available, and concentration of existing permits within particular areas.

Highlights

  • A total of 288 square kilometers within the study area is dedicated to active aggregate pits;
  • 39% of aggregate sites within the study area are found within the Greenbelt’s boundaries, while the Greenbelt covers only 29% of the study area;
  • Caledon, Adjala-Tosorontio, and Whitchurch-Stouffville, are likely to be impacted by aggregate demands for these projects the most;
  • Unrehabilitated site data from the government is unreliable, with record dates limited to a time between 2006 and 2010. Viewing sites with satellite imagery show a use-mix of what look like former aggregate pits, agricultural lands, and residential areas;
  • Furthermore, some sites overlap with each other.
Map: Municipal Vulnerability to Aggregate Activity for New Highway Construction in the GTA
Map of municipalities within a 50 km area around the Bradford Bypass and 413 highways showing their vulnerability do aggregate mining for related construction resources. Credit Simcoe County Greenbelt Coalition.
Click for larger version.

This choropleth map is segmented by municipality, and weighted according to a scoring system that combines four scores:

  • “PER_SCORE”, which is the percent of the municipality’s area covered by sand and gravel resources, excluding built up areas;
  • “DIST_SCORE”, which is a measure of the distance that the municipality is from the respective projects;
  • “TON_SCORE”, which is a measure of the total tonnage allowed in the municipality;
  • and “DEP_SCORE”, which is a measure of the depths of the sand and gravel resources contained within the municipality.

PER_SCORE

For the PER_SCORE the sand and gravel mapping, which were separate files, were combined, the built up areas in the municipality were then subtracted from the combined file, and the result was then measured as a percent of the total area of the municipality. Scores are from 1 to 4, representing 25% increments.

DIST_SCORE

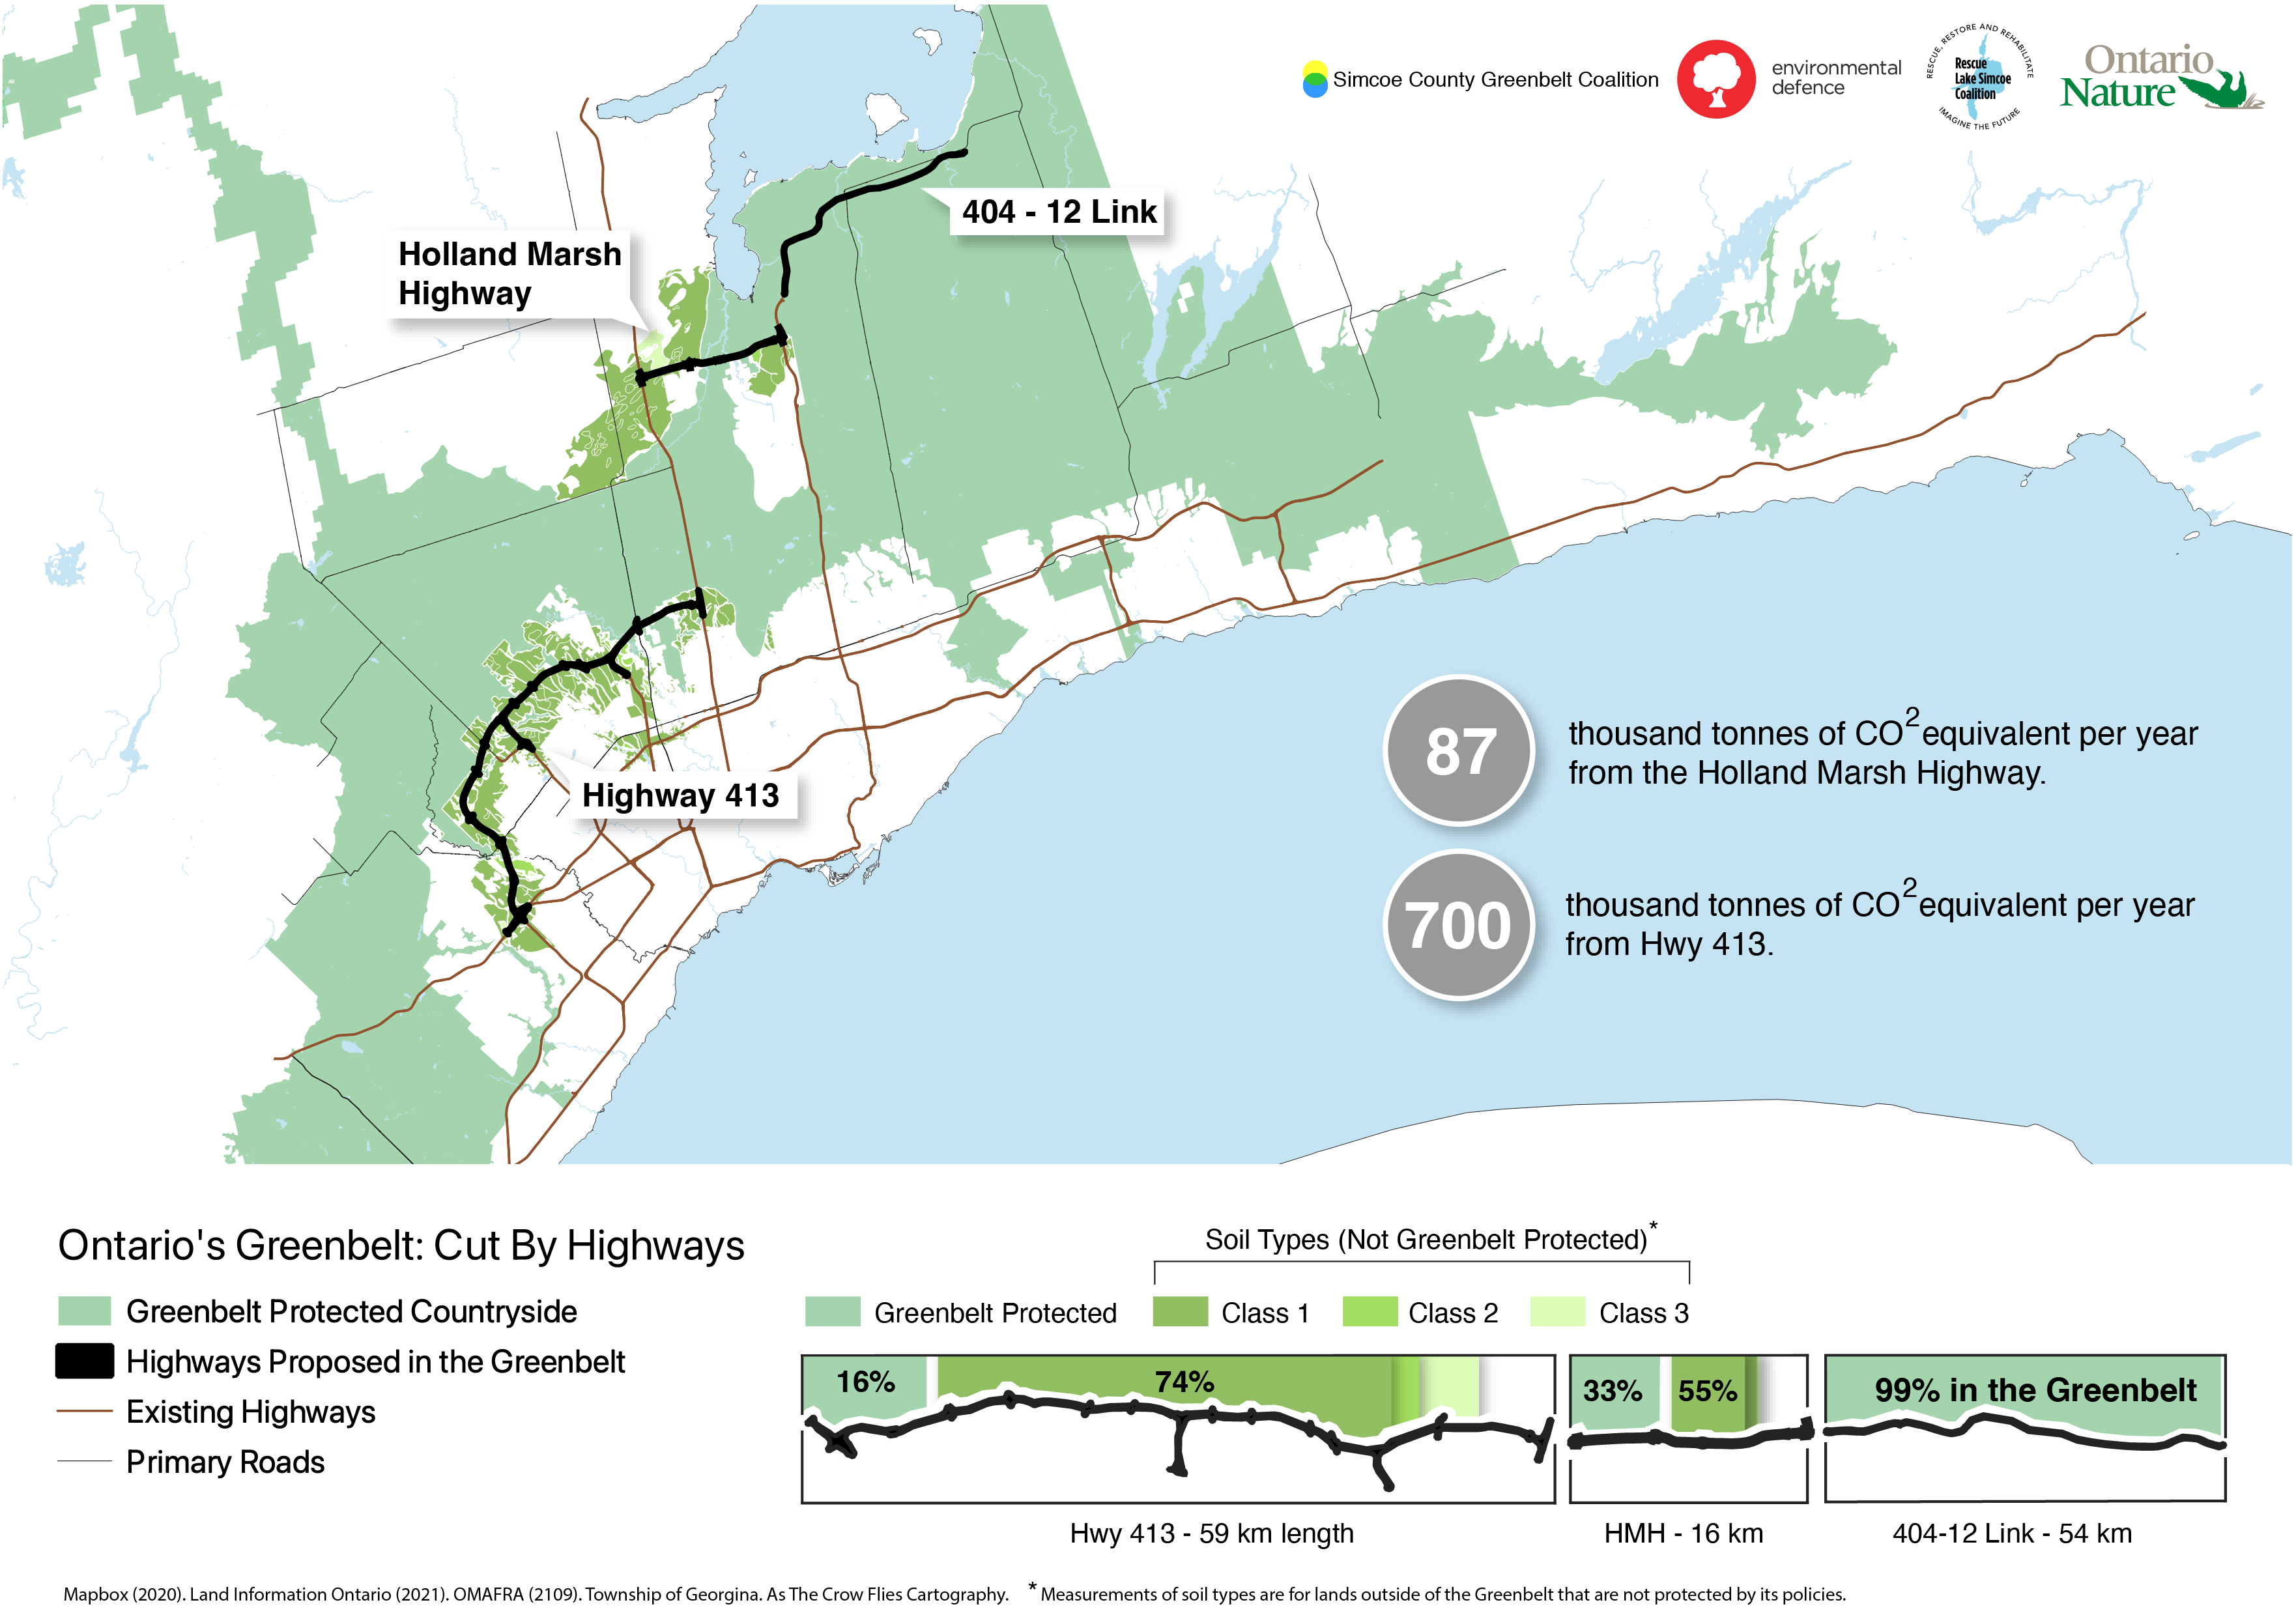
The distance scores are derived from the 20 kilometre and the 50 kilometre distances from the proposed projects. The 50 kilometer radius from the projects is based on a conservative estimate, provided by Gravel Watch Ontario, of the distance from which aggregate resources are normally sourced for projects, with that distance sometimes being expanded outward to 70 kilometers. A score of 2 was given if the municipality was within the 20 kms radius, and 1 if it was within the 50 kms radius. For municipalities within the 20 km radii of both projects a total of 4 was given, and likewise, if a municipality was within the 20 km radius of one project and the 5 km radius of another, it got a score of 3.

TON_SCORE

The tonnage score is based on a decile, with municipalities receiving a score of between 1 and 10, where 10 represents the highest total tonnage permitted within the municipality.

DEP_SCORE

A depth score of aggregate resources based on mapping by the Ontario Geological Survey (OGS) was included to give an additional metric of impact. Depth data are provided by OGS in four categories: Less than 1.5m; 1.5m to 3m; 3m to 6m; and Greater than 6m. DEP_SCORES were apportioned from 1 to 4, with 1 for 1.5m and 4 for Great than 6m.

Sources

“Aggregate site authorized – active”, Land Information Ontario. Info updated November 16, 2018. Data updated December 15, 2021. Downloaded November 25, 2021. (Link)(Data)

Aggregate Resources of Ontario—2020”,Ontario Geological Survey. Downloaded June 30, 2021. (Link)

Greenbelt outer boundary”, Land Information Ontario. Info updated August 6, 2021. Data updated May 18, 2017. Downloaded January 2, 2022. (Link)

Mapbox Base Monochrome”, Mapbox (personal account). Created January 10, 2022. Accessed January 11, 2022. (Link)

“Ontario Road Network (ORN) Road Net Element”, Ontario Ministry of Natural Resources and Forestry. Info updated September 27, 2019. Data updated January 5, 2022. (Link)

“GTA_West_RevisedRoute_August2020_Lat_Lon”, Environmental Defence/As The Crow Flies Cartography. Received November 30, 2021.

“Municipal Boundary – Lower and Single Tier”, Land Information Ontario. Info updated June 4, 2019. Data updated April 20, 2021. (Link)

Bryan Smith, of Gravel Watch Ontario, has been long involved with local aggregate issues and knows what kind of burden this will place on the rural communities that could be affected.

“These highway proposals are being touted as a net benefit, but the communities where the pits and quarries would make a Swiss cheese of the landscape will not feel the same. From increased truck traffic, wear and tear on local roads, reduced air quality, to issues with groundwater, aggregate comes at a high cost to the host municipality and its residents. There is no net benefit. Consequently, many municipalities are asking the province to make aggregate pay their fair share.”

The rock, sand and gravel extraction and its impact on communities up to 50 kilometers from the proposed routes is just another example of how the province is pushing forward these highway proposals without a full examination of their costs and impacts.

Map: Aggregate Mining in Ontario's Greenbelt
Map showing the density of aggregate activity, as well as the Greenbelt and proposed routes for the Bradford Bypass and 413 highways. Credit Simcoe County Greenbelt Coalition.
Click for larger version.

The “Aggregate Site Heatmap” is meant to show clustering of aggregate sites. This map uses one source of information shown two different ways – a heatmap, which draws attention to the density of sites, and the sites themselves, shown as polygons.

The heatmap uses data from the “Aggregate site authorized – active” file provided by the provincial government, with the sites, which are provided in polygon form, converted into centroid points. The size of the polygons is calculated into “AREA” and the centroid points are weighted by this metric.

The Greenbelt boundary is included to indicate impacts that aggregate mining may have on an area many Ontarians believe is protected from development, as well as industrial, activity. While development, understood in a strict sense of housing, may be restricted, the knock on effects of road and highway construction, this data shows, are largely not.

A measure of aggregate impact on the Greenbelt was arrived at by calculating the surface area of aggregate mines located within the Greenbelt AND within the study area. The result shows that 29% or the study area is covered by Greenbelt and 39% of the surface area of aggregate pits located within the study area are to be found within the Greenbelt boundaries.

Sources

“Aggregate site authorized – active”, Land Information Ontario. Info updated November 16, 2018. Data updated December 15, 2021. Downloaded November 25, 2021. (Link)(Data)

“Greenbelt outer boundary”, Land Information Ontario. Info updated August 6, 2021. Data updated May 18, 2017. Downloaded January 2, 2022. (Link)

“Mapbox Base Monochrome”, Mapbox (personal account). Created January 10, 2022. Accessed January 11, 2022. (Link)

Ontario Road Network (ORN) Road Net Element”, Ontario Ministry of Natural Resources and Forestry. Info updated September 27, 2019. Data updated January 5, 2022. (Link)

“GTA_West_RevisedRoute_August2020_Lat_Lon”, Environmental Defence/As The Crow Flies Cartography. Received November 30, 2021.

“Municipal Boundary – Lower and Single Tier”, >Land Information Ontario. Info updated June 4, 2019. Data updated April 20, 2021. (Link)

Tim Gray, Executive Director of Environmental Defence, is concerned that environmental assessments of the highways won’t be considering the impacts from required aggregate.

“The shocking scale of the aggregate needed to build these highways means impacts will be felt by communities across a number of regions. The federal and provincial governments have an obligation to assess and address these widespread impacts as part of a robust and thorough environmental assessment of the highway projects.”

The mapping also shows that nearly 40 per cent of the aggregate sites likely to supply material for these projects are located within the Greenbelt.

Expansion of those pits puts at risk the crucial ecosystem services the Greenbelt provides, such as clean water, fresh air, healthy food, and habitat for wildlife. These impacts of aggregate extraction on the Greenbelt are compounded by the fact that they are being used, in this case, for projects that run through the Greenbelt, and which will likely lead to increased development pressure on it.

Did you know?

Ontario's Greenbelt provides:

$2.1 billion dollars worth of recreational activity each year.

$224 million dollars worth of flood prevention every year.

$52 million equivalent of carbon absorption every year.

Margaret Prophet, Executive Director of the Simcoe County Greenbelt Coalition, believes that the highway proposals are yet another example of how this government has targeted the Greenbelt on behalf of developers.

“We heard promises that “we’re not going to touch the Greenbelt,” and yet this government wants to run two large highways right through it. The demand for aggregate, and the fact that much of it is likely to come from within the Greenbelt, only makes matters worse. The narrow focus on localized impacts creates a situation in which the Greenbelt is left vulnerable to a death by a thousand cuts. The impact of aggregate mining for these highways is a perfect example of this.”

The coalition’s research shows there is little that municipalities can do to protect citizens and ensure a healthy environment in the face of pressure from the aggregate industry.

Tim Gray adds, “The province is knowingly putting communities and the Greenbelt at risk from increased aggregate extraction to build destructive and unnecessary highways. And thanks to recently passed legislation, they have removed almost every tool municipalities used to have to limit or control these impacts. The communities located in these extraction hotspots need to be aware that if these highways go ahead it will impact them, even if they are far from the highways’ routes.”

Take Action

  • Sign the DAMN petition calling for a moratorium on all new applications for aggregate mining in Ontario.
  • Tweet a message to federal Environment Minister Steven Guilbeault asking for a federal impact assessment of the Bradford Bypass.

Related Content

Photo of a highway bridge. Credit Ajai Arif.

The Bradford Bypass – Clearing the Air

There are a lot of misconceptions, myths, and misunderstandings regarding the role that highways and cars play in our economy, and the impact they have on our environment and communities. Many of these are coming to the fore with the Bradford Bypass. Here we address some of them.

Read More »
Arial photo of the Holland Marsh, with Lake Simcoe in the distance. Credit Jeff Laidlaw.

Bradford Bypass

The provincial government is proposing a highway that would connect the 404 with the 400. The proposed route passes along the northern edge of Bradford, and through portions of the Holland Marsh.

Read More »

Community supported, advocacy for a safe and secure future.

Governments have failed to act to protect our communities and the futures of our children and grandchildren, and they continue to treat our environment as if it’s incidental to life, rather than a foundation for it.

We need strong community organizations to fight for our future, now more than ever.

Please consider donating to support our work. It’s people like you who make us possible.

Subscribe to Our Newsletter

We send out a once-monthly newsletter full of information on what’s happening in Simcoe County and beyond, including information on how you can take action to protect the health of your community.

The Bradford Bypass - Clearing the Air

There are a lot of misconceptions, myths, and misunderstandings regarding the role that highways and cars play in our economy, and the impact they have on our environment and communities. Many of these are coming to the fore with the Bradford Bypass. Here we address some of them.

Municipalities in the Lake Simcoe region, including just recently Barrie, are being asked to weigh in on the Bradford Bypass, a proposed highway that would run just north of Bradford, through the Greenbelt and Holland Marsh, to connect the 404 and 400 highways.

There have been a number of statements and assertions made in support of the project. Environmental organizations, including ours, and community members argue, however, that these points either don’t hold water, or that they represent ways of planning that are outdated in an age of environmental crises.

Let’s look at some of the main arguments supporters make and why they are wrong.

Argument 1: It isn't our problem

This argument is tied in with jurisdictional concerns, but there’s an important distinction to be made between the political boundary, on the one hand, and the impact of the project on the environment, on the other.

Let’s start with the jurisdictional concerns and then move on to the environmental impact concerns.

It’s a well established political norm to work across political boundaries to address issues that may have an environmental impact. Perhaps the most prominent example of this is the Intergovernmental Panel on Climate Change (IPCC), which has members from 195 nations. A less well known, but much older, example is the International Joint Commission, which was established in 1909 and works to address issues affecting the quality of water along the border between Canada and the United States. Much of The Great Lakes are overseen by this body.

Environmental impacts, we now understand very well, are often difficult to contain, particularly when they occur in the fluid dynamics of air and water, and so work across jurisdictional boundaries is crucial to address them. 

Photo of Barrie's waterfront during sunrise.

A more local example of the importance of working across political boundaries to address environmental impacts is our Conservation Authorities, which are established according to the natural boundaries of watersheds, and so attempt to capture, in a sense, the environmental impact of our actions.

Now, to address the more localized impacts and whether a highway in Bradford will affect those of us living in Barrie.

Part of the rationale for building the highway is to accommodate the projected population growth in Simcoe County, not simply the growth that is expected in the Bradford area. The vehicle trips this project is intended to accommodate come, in large part, from surrounding municipalities, including Innisfil and Barrie, which sends commuters down the 400 highway toward Toronto and the GTA. 

(As an aside, there have also been a number of comments made, including by the mayor of Innisfil, that discount the voices of those who don’t live in the immediate area. These voices come from communities the Bypass is meant to serve. Accordingly, the decision of whether to continue to pour public funds into highways and car-centric development will impact how communities are shaped in these surrounding areas, determining, for example, whether there’s money available to ensure residents there have access to well-connected transit and/or safe cycling and walking routes.)

Argument 2: A new highway will reduce emissions and help combat climate change

The notion that a highway will reduce emissions seems to be based on the idea that vehicles stuck in traffic emit more greenhouse gases than those not stuck in traffic.

On the surface this seems like a reasonable argument, but the data, and experience, doesn’t back it up. Below, we cover two of the most glaring reasons why this doesn’t hold. 

Induced Demand

As more roads and highways are built, the consequence is more use of roads and highways – one begets the other. As roads and highways make land more accessible commercial centres are built at interchanges and residential areas are developed, and with this more vehicles flood into the extra capacity that has been created.

This phenomenon is known as “induced demand,” and it has been shown to happen over and over again when roads are expanded and highways built to “ease congestion.”

(Who doesn’t want congestion eased? The problem is that this just doesn’t accomplish that. Want to spend less time stuck in your car? Stop building roads as the primary way of getting everywhere.)

Evidence shows that the eventual result of these efforts to ease congestion is always more congestion. (Some of you may have also noticed that increased demand is exactly the business case proponents are making for the highway, so there’s that, too.)

The Free Burger Analogy

Here’s a great analogy of that helps explain induced demand.

Imagine that 10,000 free hamburgers are placed in the central square of a city, with a lead time of preparation and notice given to the public (as would happen with building a highway).

What would happen?

People would come and eat the hamburgers, and soon there would be none left.

There would soon be a problem, however.

More people would come to get the free meals than what’s available.

The solution?

Put out more free burgers. And so on and so forth.

Alternatives, such as the taco joint down the street, would be decimated.

This is exactly what happens to public transit and walkable communities every time we build more highways and car-centred sprawl.

See the original post here.

There’s also this explainer, but it doesn’t include hamburgers… you’ve been forewarned.

Idling cars produce more GHG emissions than moving cars

Studies show that this is a myth. Emissions are actually strongly correlated with the distance and rate or speed of travel, and weakly correlated with the level of congestion.1Congestion and emissions mitigation: A comparison of capacity, demand, and vehicle based strategies

Vehicles travelling at higher speeds emit more GHGs than those moving at lower speeds. Building more highways and inducing more people to travel at higher speeds leads to higher emissions. This is compounded by induced demand, which sees more vehicular traffic occur.

There are further reasons why this argument is no longer valid.

Vehicles sold today are increasingly equipped with kill switches that turn off the engine when the car is stationary. Accordingly, vehicles stopped in traffic are producing very little, if any, GHG emissions. Further, and this is linked to a lengthy explanation below, government policy is increasingly geared towards promotion of a modal shift from vehicles with internal combustion engines to those with electric drives. In both cases emissions from idling, even without the research noted above, is made moot.

Argument 3: We need highways to prepare for growth

It is true that we need to plan and prepare to meet increased growth. The question that needs to be answered, however, is how can we do this in a way that is efficient? In other words, how do we make the best use of the resources available to us? (More people means more pressure on resources. If we plan prudently we can ensure that that pressure is lessened, so that our communities can continue to rely on clean water, vibrant green spaces, and fertile farmland.)

Here again highways fail to make the grade.

Highways, most often used to transport a single person per car, are possibly the least efficient option for transportation.

This lack of efficiency – the cost that cars have – has real impacts on our society, including on municipal budgets.

There is currently a multi-billion dollar infrastructure deficit in Ontario, much of it related to roads. This is a cost borne by the taxpayer.2Canadian Infrastructure Report Card

(Roads and highways, if you think about it, are basically subsidies to developers, since they cost more for the public to maintain than they return to the economy when compared with alternatives such as complete communities linked by rail. See the graphic below for more on this.)

Click for a larger version. Learn more about these costs at thediscourse.ca/scarborough/full-cost-commute.

If we are serious about preparing to accommodate the projected growth in population that our region will see in the coming decades, we need to be looking at options that are efficient, that give the best return to the taxpayer, that protect the crucial resources our communities rely on, such as wetlands that filter water, forests that provide habitat for wildlife and filter air of pollutants, and farmland that provides us with healthy, local food.

This last point, the value of supporting a local food ecosystem, is particularly important given the price shocks we have been exposed to with a stretched out global supply chain. It’s also particularly salient given the area this highway will impact, the Holland Marsh or the “Salad belt”, which has some of Ontario’s most valuable, productive farmland. 

The increasing cost of food is something we’ve all experienced over the course of the pandemic, and it’s a factor that will only increase in volatility as climate change increasingly impacts agricultural areas in closer to the equator. The US breadbasket, for example, and the aquifer it relies upon, the Ogallala Aquifer, the country’s largest, is facing serious risks due to increased temperatures from climate change.

Congestion is a drag

This argument is pretty straight forward – the more time people and goods spend stuck in traffic, the more money and potential productivity our economy loses.

Even if you’ve entirely bought into the notion that the best economy is the most productive economy (there is a growing chorus from economists and activists taking issue with this notion, pointing out that the goal of our economy should be to promote the health and well-being of citizens, rather than the simplistic, never-ending pursuit of GDP growth, and the corollary impacts it has on the health of the environment, as well on our social and mental health) the straight forward solution to this would be to plan for strongly connected, complete communities.

These are communities in which efficient transportation is prioritized, enabling people to get to and from work easily and without relying on cars. (Cars and their operation, after all, suck up a lot of financial resources that could otherwise be circulating within the local economy.)

Argument 4: We will all be driving electric vehicles soon, so we don't need to worry about emissions

There are other ways in which our car-centric planning, which highways perpetuate, is creating problems. Many jurisdictions will be hard-pressed to meet GHG emissions targets due to the over-reliance on cars that our communities have – a long history of building for cars rather than for people.

A key method for achieving a large portion of reductions, though even with this their targets, for the most part, are still badly missed, is encouraging a modal shift in transportation from internal combustion engines to electric vehicles. 

A reliance on EVs for emission reductions raises several red flags, however. EVs are an important tool in transitioning to an economy that is in line with what’s needed to ensure a safe planet for our children and grandchildren, but they are just that, a tool to transition.

The more that we rely on EVs the greater the risk we build into our strategies for reducing GHG emissions, and, importantly, our environmental and social impact.

Again, this is one of those issues that on the surface appears to be a no-brainer, but it’s exactly for this reason that it’s problematic.

Phantom reductions

EVs, on their own, represent a stark contrast with the heavy impact we now know is associated with cars using internal combustion engines. Run an EV in a garage with the door closed and you don’t have any problems.

Where things start to get tricky, however, is when you consider the complete cost of the EV, including the source of the power an EV is using and the materials required for its components.

The electricity used to power an EV may not be from a renewable source. Ontario currently generates part of its power with natural gas. Natural gas is a source of methane, which, gram for gram, is one of the most potent GHGs. 

Most of the natural gas that we use in Ontario, and this goes for home heating and cooking as well, comes from Alberta and BC, where fracking is used to extract it from the ground. Methane is released in the process of fracking as well, along with a number of other highly damaging environmental impacts. There is also an increasingly large liability of abandoned wells, which the public is likely on the hook for.

Picture of an oil drill with a red sunset behind it. Credit Zbynek Burival.

“Most of the natural gas that we use in Ontario, and this goes for home heating and cooking as well, comes from Alberta and BC, where fracking is used to extract it from the ground.”

The important point here, however, isn’t necessarily the type of power that is being used, but rather the ability of governments to effectively control the type of power. Relying on EVs for emissions reductions may be an effective political win locally, but without an ability to determine where the power is coming from, governments are taking a risk that emissions will simply be displaced from one jurisdiction to another.

The control, or lack thereof, that local governments have over the power generation mix pales in comparison to their control over where the materials used in EVs come from.

This is where risk starts to increase exponentially. Emissions reductions can be claimed locally, but what in fact has happened is they have been displaced elsewhere. This opens the door to a race-to-the-bottom scenario where some jurisdictions are forced to compete for emissions, becoming a dumping ground for the reductions gained in wealthier areas. This dynamic is already occurring, with certain parts of the world, largely in the global south, competing to attract economic investment by slashing environmental regulations. (And here in Ontario, the provincial government’s COVID economic recovery strategy has been largely based on skirting environmental regulation in order to push forward with developments.)

Perpetuating colonialism

The components used in batteries come, in large part, from countries in the global south.

Lithium is largely found in arid regions of Bolivia and Chile. Mining lithium requires huge amounts of water, as well as sulphuric acid, and the use of these resources is wreaking havoc on local environments.

A copper mine in Chile.

Cobalt is mostly mined in the Democratic Republic of Congo, where child labour is often implicated and a near complete lack of environmental regulation and protections exists.

While we don’t use power generated in these areas, we are nevertheless displacing a huge environmental burden onto them with our efforts to reduce our emissions through our reliance on EVs.

This is not only an environmental issue, it is also, and perhaps more importantly, a social justice issue.

Those of us who are able to afford an EV are far more responsible for climate change than those who live in these areas of the world.

Placing the burden of our emissions reductions on those who are not responsible for climate change represents a profound injustice. This is a continuance of colonialism, whereby the externalities of our economic and social activity are dumped, effectively, onto regions and people who don’t have the means to defend themselves, people and communities who are already at a disadvantage due to centuries of the very same colonialism, the extraction of value, that has so greatly benefited the global north. Such a dynamic is a taking over of their environment, of their communities and their farmland and their rivers and streams and aquifers, for our purposes. To the extent that we rely on solutions with a long tail, whereby the impacts are felt in ways that we do not have to directly grapple with, we assume an increased risk of wrong and error associated with that activity. 

Additional costs

Recycling of the materials associated with EVs represents another challenge that municipalities will have to face.

While current lithium-ion batteries are difficult to fully recycling, new solid state batteries anticipated to come online soon should be easier. This is a double-edged sword, however, meaning that while the impact to the global south may be somewhat reduced (see induced demand for why this won’t solve the problems here), it will make it more likely that this is a service that local governments are expected to support.

There are also factors that many governments don’t seem to be including yet in their future estimation of infrastructure costs, namely the added weight associated with EVs and the impact that will have on roads.3Vehicle Weight vs Road Damage Levels 

This means that as more EVs use our roads, we will need to increase road weight tolerances, which means we’ll be increasing the amount of aggregate that we need to mine or recycle. All of this increases the amount of money that we need to spend on car infrastructure.

Conclusion

We really need to be planning now for the communities that we want in twenty, thirty, fifty years from now. We need to do this in a way that preserves and enhances the natural resources that we have, so that our economy can continue to flourish for our children and grandchildren, and not be depleted in the short-term here and now.

Build within the urban boundary for density so that people can access groceries and workplaces and schools and parks by walking and cycling. This has benefits for our health and wellbeing as well as for our pocketbooks freeing up money in the household budget, otherwise spent on cars, that can instead be spent on quality time with family and friends.

Freeing us up from the expense of owning and operating a car – the second-biggest expense in Canadian households – also makes it possible to transition to a four-day work week, further supporting the health and wellbeing of citizens and helping to reduce the impact that our economy has on the environment.

Build high-speed rail between urban hubs so that we don’t need highways, and situate neighbourhood car-sharing nodes, so residents can access efficient and affordable personal transportation options if required.

All of this, compared to the costs associated with building highways and pouring money into mitigation the costs that will follow them, is in fact easy. All it requires is vision and leadership.

Young girl with a bubble. Credit Leo Rivas.

How Can You Get Involved?

  1. Links and resources are available here: linktr.ee/stopthebradfordbypass
  2. Visit our Bradford Bypass issues page to learn more about the project.
  3. Donate to help us fight this highway! See how some of our efforts have paid off in a Toronto Star/National Observer investigation into the highway.
Photo of a highway bridge. Credit Ajai Arif.
Planning

The Bradford Bypass – Clearing the Air

There are a lot of misconceptions, myths, and misunderstandings regarding the role that highways and cars play in our economy, and the impact they have on our environment and communities. Many of these are coming to the fore with the Bradford Bypass. Here we address some of them.

Read More
Arial photo of the Holland Marsh, with Lake Simcoe in the distance. Credit Jeff Laidlaw.
Climate Change

Bradford Bypass

The provincial government is proposing a highway that would connect the 404 with the 400. The proposed route passes along the northern edge of Bradford, and through portions of the Holland Marsh.

Read More

Sprawl and Ontario's Greenbelt

Sprawl is one of the most wasteful forms of development, leading Ontario’s former Environmental Commissioner to call it “Ontario’s oil sands.” A strong Growth Plan, together with an expanded Greenbelt, can help ensure growth in a way that is sustainable and more cost effective.

Sprawl is the Dominant Growth Style in Simcoe County

We’ve been dealing with losing our natural spaces and farmland to sprawl in this region for a long time. It’s been the main way we’ve grown our communities for decades, and we continue to do so, even though it’s outdated and extremely wasteful, today.

Consider:

  • Between 2006 and 2014, Simcoe County released more greenfield lands for development (sprawl)  than any other region in southern Ontario. This, despite the fact that the amount of growth they were anticipated to receive was much less than many places;1Neptis (2013) Implementing the Growth Plan for the Greater Golden Horseshoe
  • The IGAP report in 2006 outlined that due to urbanization pressure of sprawl and without intervening action, “the available potable water and aquaculture of these watersheds are threatened” within Simcoe County;2Intergovernmental Action Plan for Simcoe County. (2006)
  • The Lake Simcoe watershed is calculated to lose 12,000 hectares of natural and semi-natural space by 2031.  That’s equivalent to 1000 Vaughan Mills Malls;3Ministry of the Environment and Climate Change. (2014).  Minister’s Report on Lake Simcoe
  • Over the past 40 years, Barrie’s footprint grew by 550% losing over 150km2 of natural and semi-natural space.4Statistics Canada

What Can Be Done?

First and foremost, we have to intentionally choose different development patterns.  Sprawl must be stopped and settlement boundaries must be held firm. 

Unfortunately, this doesn’t make developers and those wanting to cash out very rich. 

As a result, extreme lobbying efforts within our municipal councils promote sprawling patterns as a supposed answer to economic woes – which simply isn’t true. 

In fact, sprawling developments have been shown time and time again to cost the municipality more than what it brings in with new tax revenue and growth.5Report: The High Cost of Sprawl

Infographic on the high cost of sprawl. Credit: Smart Prosperity Institute.
Infographic on the high cost of sprawl. Credit: Smart Prosperity Institute. (Click image for larger version.)

We can also address this through provincial policy, specifically, the Greenbelt. 

The Greenbelt Plan was created to direct growth to existing communities to prevent sprawl from paving over farmland and our most precious, sensitive landscapes. 

Ontario’s Greenbelt policies have been recognized internationally as one of the most legally effective and clear policies when compared against other greenbelt across the globe. 

Although far from perfect, the Greenbelt has been shown to stop the loss of farmland to sprawl, support water systems and act as a natural solution to climate change.

The only thing that is required is political will to prioritize protection of our water, wetlands, greenspaces and farmland over outdated economic policies that are based on infrastructure such as sprawl, highways and pipelines.

We Have an Opportunity to Shift Our Decisions

The province is asking for feedback about how and where to grow the Greenbelt in Ontario. 

Frankly, we think we should protect as much of our land and water as possible – our economy, food security and water security depend on it. 

However, we also recognize that the political will isn’t as bold as the vision that Ontarians may have, so that’s where citizens need to push the needle. 

We need to have conversations about how we create healthy, sustainable, thriving communities. 

Science is showing us that our patterns and choices are problematic for our own survival. 

Let’s start by doing one meaningful thing – grow the Greenbelt to the rest of the Lake Simcoe basin, to areas within Simcoe County that are important to providing clean water, air and food for residents. 

Better is always possible even if it isn’t politically expedient.

Related Content

This illustration image of Poilievre combines a frame from a now notorious engagement where he belittled a journalist while eating an apple, with a photo of a forest fire added as a backdrop, in place of the orchard.
Climate Change

Issue In Brief: Understanding the Carbon Tax

The debate around the carbon tax frequently misses its broader economic and environmental benefits. By effectively addressing the externality of carbon emissions, the carbon tax stands as a critical component of Canada’s strategy to combat climate change and promote sustainable growth. Clear communication and understanding of the policy’s benefits, including the progressive rebate program, are vital in navigating public concerns and fostering support for this essential environmental initiative.

Read More »
A photo of scaffolding on a construction site. Photo by Tolu Olubode on Unsplash.
Affordable Housing

Analysis: More Homes Built Faster Act

Recent moves by Ontario’s government seem likely to create conditions for a number of crises in the next few decades that, when combined, are greater than the sum of their parts. This is what’s known as a “polycrisis”, a term popularized by economic historian Adam Tooze.

Read More »
Photo of an urban park, with benches on which people are sitting in the foreground and lawn and trees in the background. Photo by I Do Nothing But Love on Unsplash .
Planning

Simcoe County 2022 – 2051 Land Needs Assessment

…value in the context of a community is achieved through livability, which in turn drives economic and social dynamism. Propinquity, or the accessibility of the areas we inhabit, whether that’s for people we socialise with or for consumer good or employment, is the key metric to achieve in this regard. Build communities for people and good things happen.

Read More »

Subscribe to Our Newsletter

We send out a once-monthly newsletter full of information on what’s happening in Simcoe County and beyond, including information on how you can take action to protect the health of your community.

Expanding the Greenbelt as part of a natural solution to climate change

Expanding Ontario’s Greenbelt would be an important tool in the fight against climate breakdown.

The Greenbelt Does More Than You Might Think

Many people know the Greenbelt as a place that protects farmland and preserves green spaces. To many it is seen as a last refuge of vast tracts of land that allow for recreational activities and local food production.

However, the Greenbelt, by preserving those lands, provides services to our communities essentially without charge.

These services, known as “ecosystem” services,” include water and air purification, flooding control and protecting habitat of threatened species. The Greenbelt’s ecosystem services are valued at $3.2 billion per year.

We simply cannot afford to replace what the Greenbelt does for free with man made solutions which are not as effective or efficient.

Photo of flooding. Credit Nazrin B-va.

As climate change becomes increasingly severe, and our communities experience more flooding, more stress on our natural systems and extreme storm events as a result. We will need to think about solutions that are efficient, effective and improve the living conditions of human and natural communities. That is where an expanded Greenbelt comes in.

How the Greenbelt Helps

By limiting where development and aggregate extraction occurs, the Greenbelt policies ensure that two of our major GHG contributors (transportation and housing) are restricted while our natural systems are preserved and allowed to perform their functions uninhibited.

The more intact wetlands, forest systems, moraines and natural heritage systems we include in the Greenbelt, the more these ecosystems will be protected and can help us adapt and mitigate climate change.

Billions of Dollars Every Year

In fact, the existing system of wetlands, farm fields and forests within the Greenbelt sequesters roughly $111.17 B of carbon dioxide.

Each year, the Greenbelt sequesters close to an additional $52 M of carbon dioxide.

Imagine how much more carbon dioxide we could sequester if we protected even more land.

With the advent of Minister Zoning Orders (MZOs) and weakened environmental policies, the natural systems and farmland we have outside of the Greenbelt is not guaranteed protection.

A report we commissioned with the Rescue Lake Simcoe Coalition found that only 14% of Simcoe County’s green space and water resources were strongly protected. However, the policy changes mentioned previously, put even that 14% at risk.

Choosing How to Grow

We know that Ontario and our region is slated to grow.

We also know that the places we love including Lake Simcoe and our forests and watersheds are declining in health.

Our farmland is being replaced with strip malls and urban sprawl at an increasing rate.

If trends continue and we easily offer up our wetlands, forests, farmland and shorelines for sprawl and “progress” what will be left?

Related Content

Events

Gather For The Greenbelt

Corporate sponsorship opportunities for the “Gather for the Greenbelt” event in Barrie, Ontario, featuring in-person storytelling from Margaret Atwood, special guests Sarah Harmer, Jeff Monague, and poetry from Barrie’s Poet Laureate, Tyneisha Thomas.

Art installation by Rochelle Rubinstein will be featured, as well.

Read More »
Photo of a field with a sunset in the distance. There's a tree branch overhead near the photography, and a partial treeline on the left in the distance. The field is bright green grass, and the sky is rich yellow, orange, and blue hues. Credit Benjamin Davies.
Letter

Public Letter – Local MPPs Accountable for Greenbelt Scandal

Dear MPP Downey, MPP Dunlop and MPP Mulroney,

In December of 2022, you and your cabinet colleagues signed off on removal of 7400 acres of Greenbelt lands.

Thanks to a thorough investigation by the Auditor General the public now knows that the process that led to your approval of Greenbelt takeouts was “biased” and gave “preferential treatment” to a select few developers…

Read More »

Subscribe to Our Newsletter

We send out a once-monthly newsletter full of information on what’s happening in Simcoe County and beyond, including information on how you can take action to protect the health of your community.

Hi there!


Use this form to send an email to our general inquiries address.

Photo of a giraffe's head against a clear blue sky. Credit Gary Bendig.

This site is protected by reCAPTCHA and the Google Privacy Policy and Terms of Service apply.

Hi there!

Use this form to send Margaret an email.

This site is protected by reCAPTCHA and the Google Privacy Policy and Terms of Service apply.

Hi there!


Use this form to send Adam an email.

Adam-2

This site is protected by reCAPTCHA and the Google Privacy Policy and Terms of Service apply.

Hi there!


Use this form to send Julie an email.

This site is protected by reCAPTCHA and the Google Privacy Policy and Terms of Service apply.

Thank you for signing up!

Hi there!

Will you give a small amount to help us continue to do the work that we do?

As a small, grassroots environmental organization, each contribution we receive truly makes a big difference.

Subscribe to Our Newsletter!

A monthly missive, full of information on what’s happening in Simcoe County and beyond, community polls you can vote in, and deep dives into key topics.

Become part of our network. Stay informed. Take action. Protect Ontario.

Friends. Online censorship by unaccountable tech companies, combined with an all-out assault on the Greenbelt by Ontario’s developers/government, make this a perilous time for the future of democracy and the power of the people in Ontario.

We need to build new ways of empowering those who believe in accountability, in a healthy environment, and in communities ready to thrive in the economy of tomorrow.

Join our supporter network and stay informed about efforts and actions to protect the Greenbelt, to build communities that support the health and well-being of people, and to lay the foundations of a resilient, climate friendly future.