Beautiful map posters for your home, office, and cottage wall.
Welcome to our store!
Proceeds from purchases made here all go to supporting the work that we do, advocating for better communities that put our health and future prosperity at the fore.
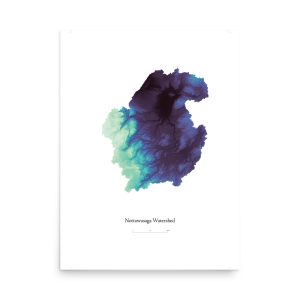
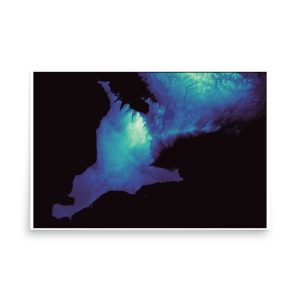
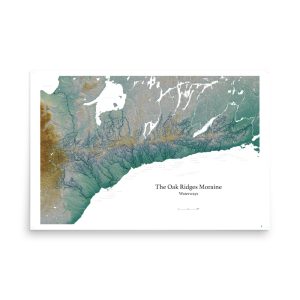
Much of what you will see here stems for that work, such as mapping that highlights natural features of an area. This is something that we often don’t see when you look at a map, where roads and urban areas are made the central focus.
We will be adding maps of The Greenbelt, the Oak Ridges Moraine, municipalities in Simcoe County, as well as other watersheds and natural features.
If you have a request for a custom map, or an idea for a map idea you think would fit well in our store, get in touch! :)
Become part of our network. Stay informed. Take action. Protect Ontario.
Friends. Online censorship by unaccountable tech companies, combined with an all-out assault on the Greenbelt by Ontario’s developers/government, make this a perilous time for the future of democracy and the power of the people in Ontario.
We need to build new ways of empowering those who believe in accountability, in a healthy environment, and in communities ready to thrive in the economy of tomorrow.
Join our supporter network and stay informed about efforts and actions to protect the Greenbelt, to build communities that support the health and well-being of people, and to lay the foundations of a resilient, climate friendly future.