Research: Air Quality Impacts of the Bradford Bypass
The proposed Bradford Bypass highway will negatively impact the air quality of residents, though to what extent and where is more difficult to determine. Our research shows that proponents haven’t thoroughly studied these impacts, and attempts to provide some further information regarding what they might be.
This is a post dealing with the impacts that construction of the Bradford Bypass could have on the surrounding community and, more broadly, on the GTA and Ontario.
To view more content related to the proposed highway visit our Bradford Bypass page.
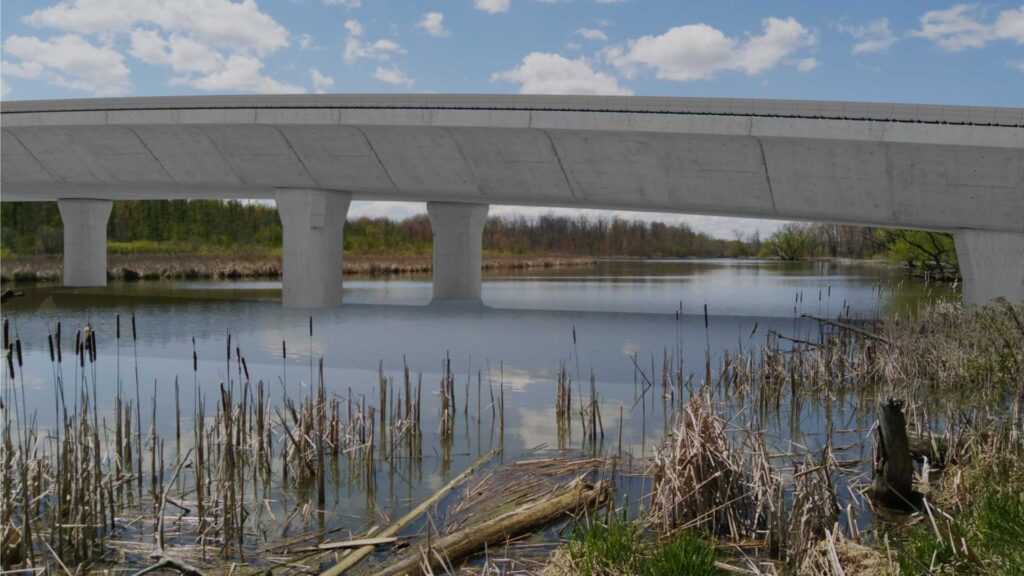
New research by SCGC shows that the negative impacts from construction of the Bradford Bypass could be more wide-spread and severe than what is shown by proponents, specifically in the final Environmental Conditions Report.
Two maps were created to illustrate findings, highlighting additional information regarding where these impacts could be felt, as well as the severity of impacts.
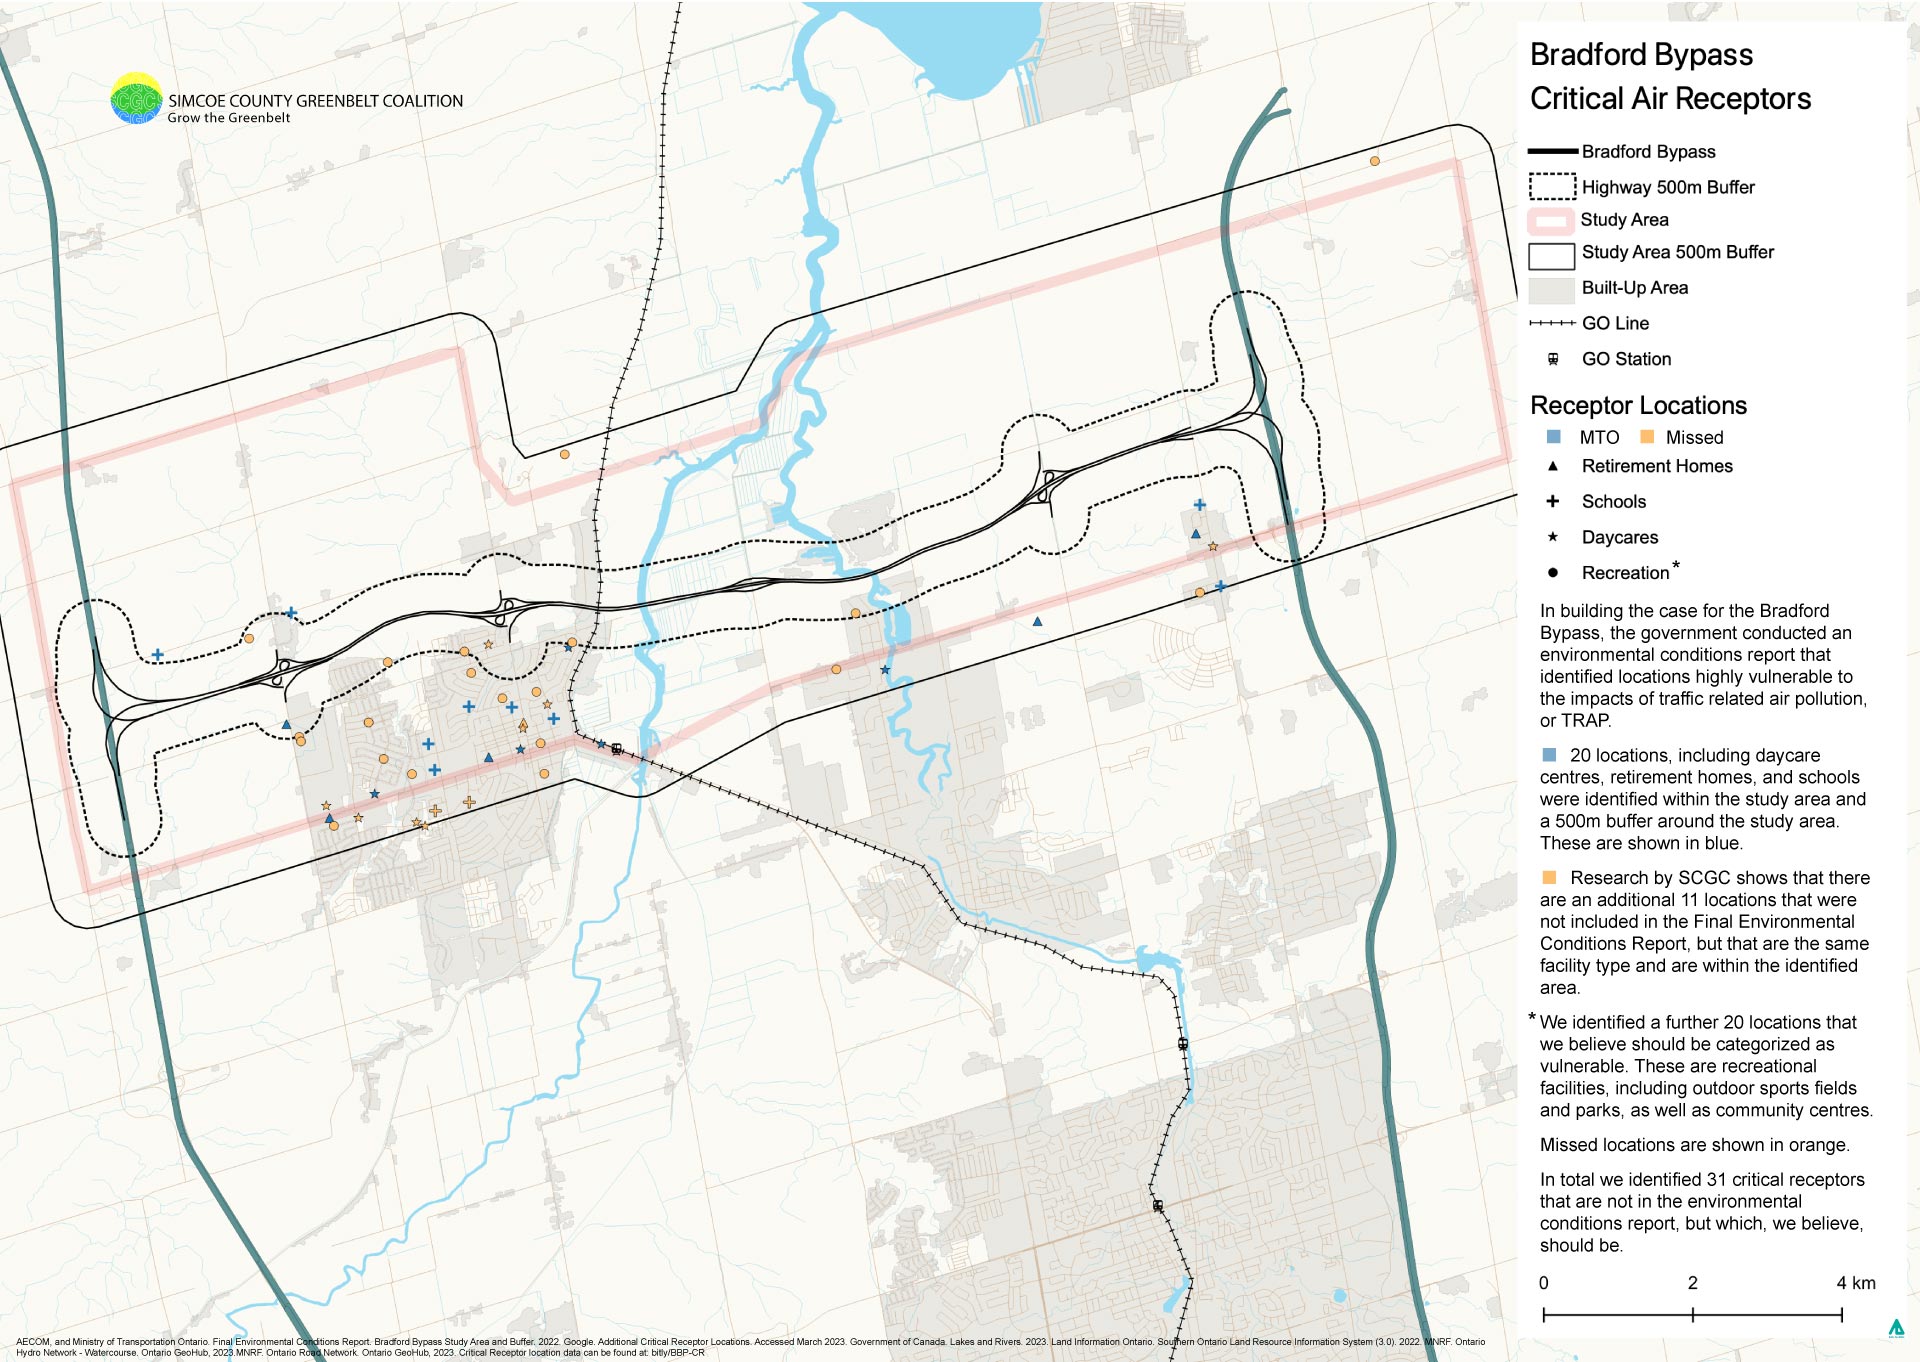
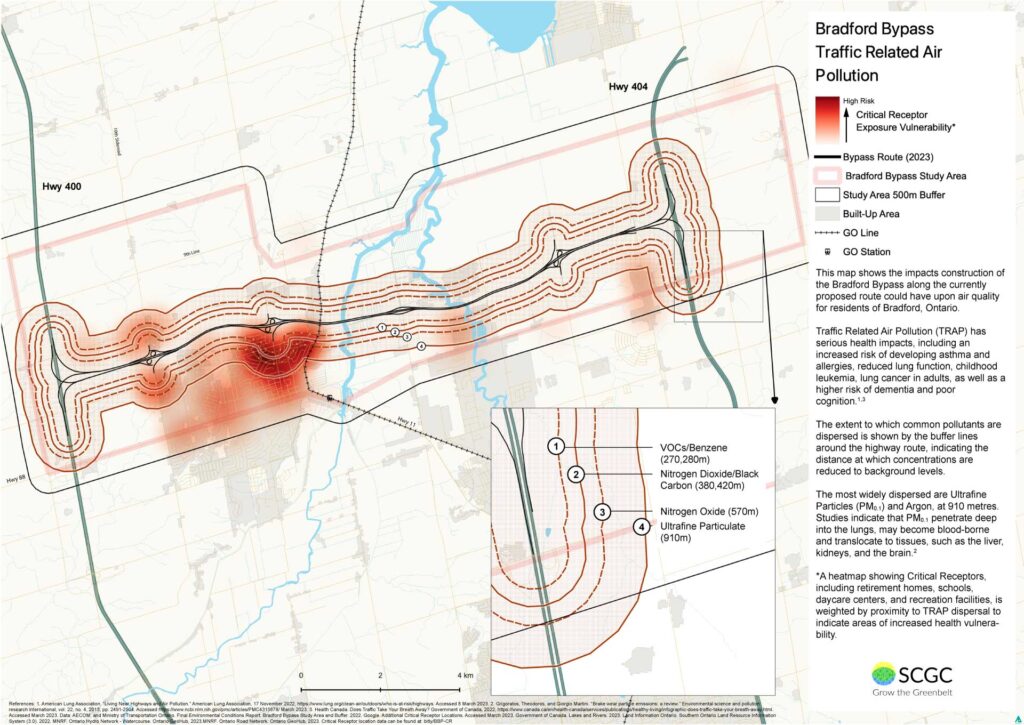
The first map identifies Critical Receptor locations in the Bradford area where the impacts from degraded air quality might be most severe, is shown below. The second incorporates the dispersion distances of common contaminants, and combines that with the CR location’s proximity to each other, weighted by proximity to the highway and contamination dispersion areas, to illustrate where the greatest cause for concern might be.
Critical Receptor Map
Traffic related air pollution (TRAP) is both a well-known risk and emerging concern to public health.
The fact of negative health impacts of TRAP, which can be long lasting, cumulative, and severe, is well established among researchers and public health practitioners, though perhaps less well by the public. As the technology of our vehicles changes, however, and as research methods evolve new concerns regarding negative health impacts continue to emerge.
In the Final Environmental Conditions Report (ECR), prepared by AECON for the Ministry of Transportation, 20 Critical Receptor (CR) locations are identified. These are defined in the ECR as, ‘“retirement homes, hospitals, childcare centres, schools and similar institutional buildings” within the Ministry’s Air Quality Guide.”1See page 208 of the ECR, linked above.
We conducted a desktop review, the method used by AECON in ECR for their assessment of CR locations, and found an additional 11 CR locations that match the types outlined above.
We found a further 20 locations within the study area that we believe, while not strictly within the definition, represent locations where risk of health impacts due to poor air quality is heightened, and should thus also be classified as CRs. These include recreational facilities, such as outdoor sports fields, parks, playgrounds, as well as community and recreation centres.
On the map below AECON/MTO identified CR locations are shown in blue, while locations found by us are shown in orange. A triangle indicates retirement homes, cross schools, star daycare centres, and ellipse recreational facilities.
In total 31 additional CR locations were identified where poor air quality could have an out-sized impact on human health.
Mapping showing where critical receptors for air quality impacts were identified by the MTO and AECON, as well as additional locations identified by research conducted independently by SCGC.
This research discovered an additional 31 locations where degraded air quality due to highway traffic could have an out-sized impact on the health of children and other residents.
Click the map to view a larger size.
While research into the health impacts of short-term, high-intensity exposure to TRAP is still emerging, concerns already exist that strongly indicate a prudent approach, mitigating exposure where and when possible, would be wise.
Health Canada, together with the Sport Information and Resource Centre, provide guidance to this effect,2Understanding Air Quality: A Guiding Document for Sport Organizations while recognizing that better understanding remains necessary to protect the health of sport participants.
What should give more cause for concern regarding sport participation among the youth in areas affected by TRAP is that young cardio-vascular systems are still developing. While this may mean there is more capacity for them to develop out of negative impacts, it also means that potential impacts have out-sized influence on physiological development.
Sport participants, furthermore, are more likely to continue to engage in strenuous exercise, and to the extent they do so in areas impacted by TRAP the likelihood of developing negative health outcomes increases.
This all strongly supports, we believe, the inclusion of recreational and exercise facilities in air quality studies and the impacts TRAP may have on human health.
Select locations are highlighted, below, to show instances of critical receptors that were not included in the Environmental Conditions Report.
Hover over the arrow hotspots for a description of the highlighted location.
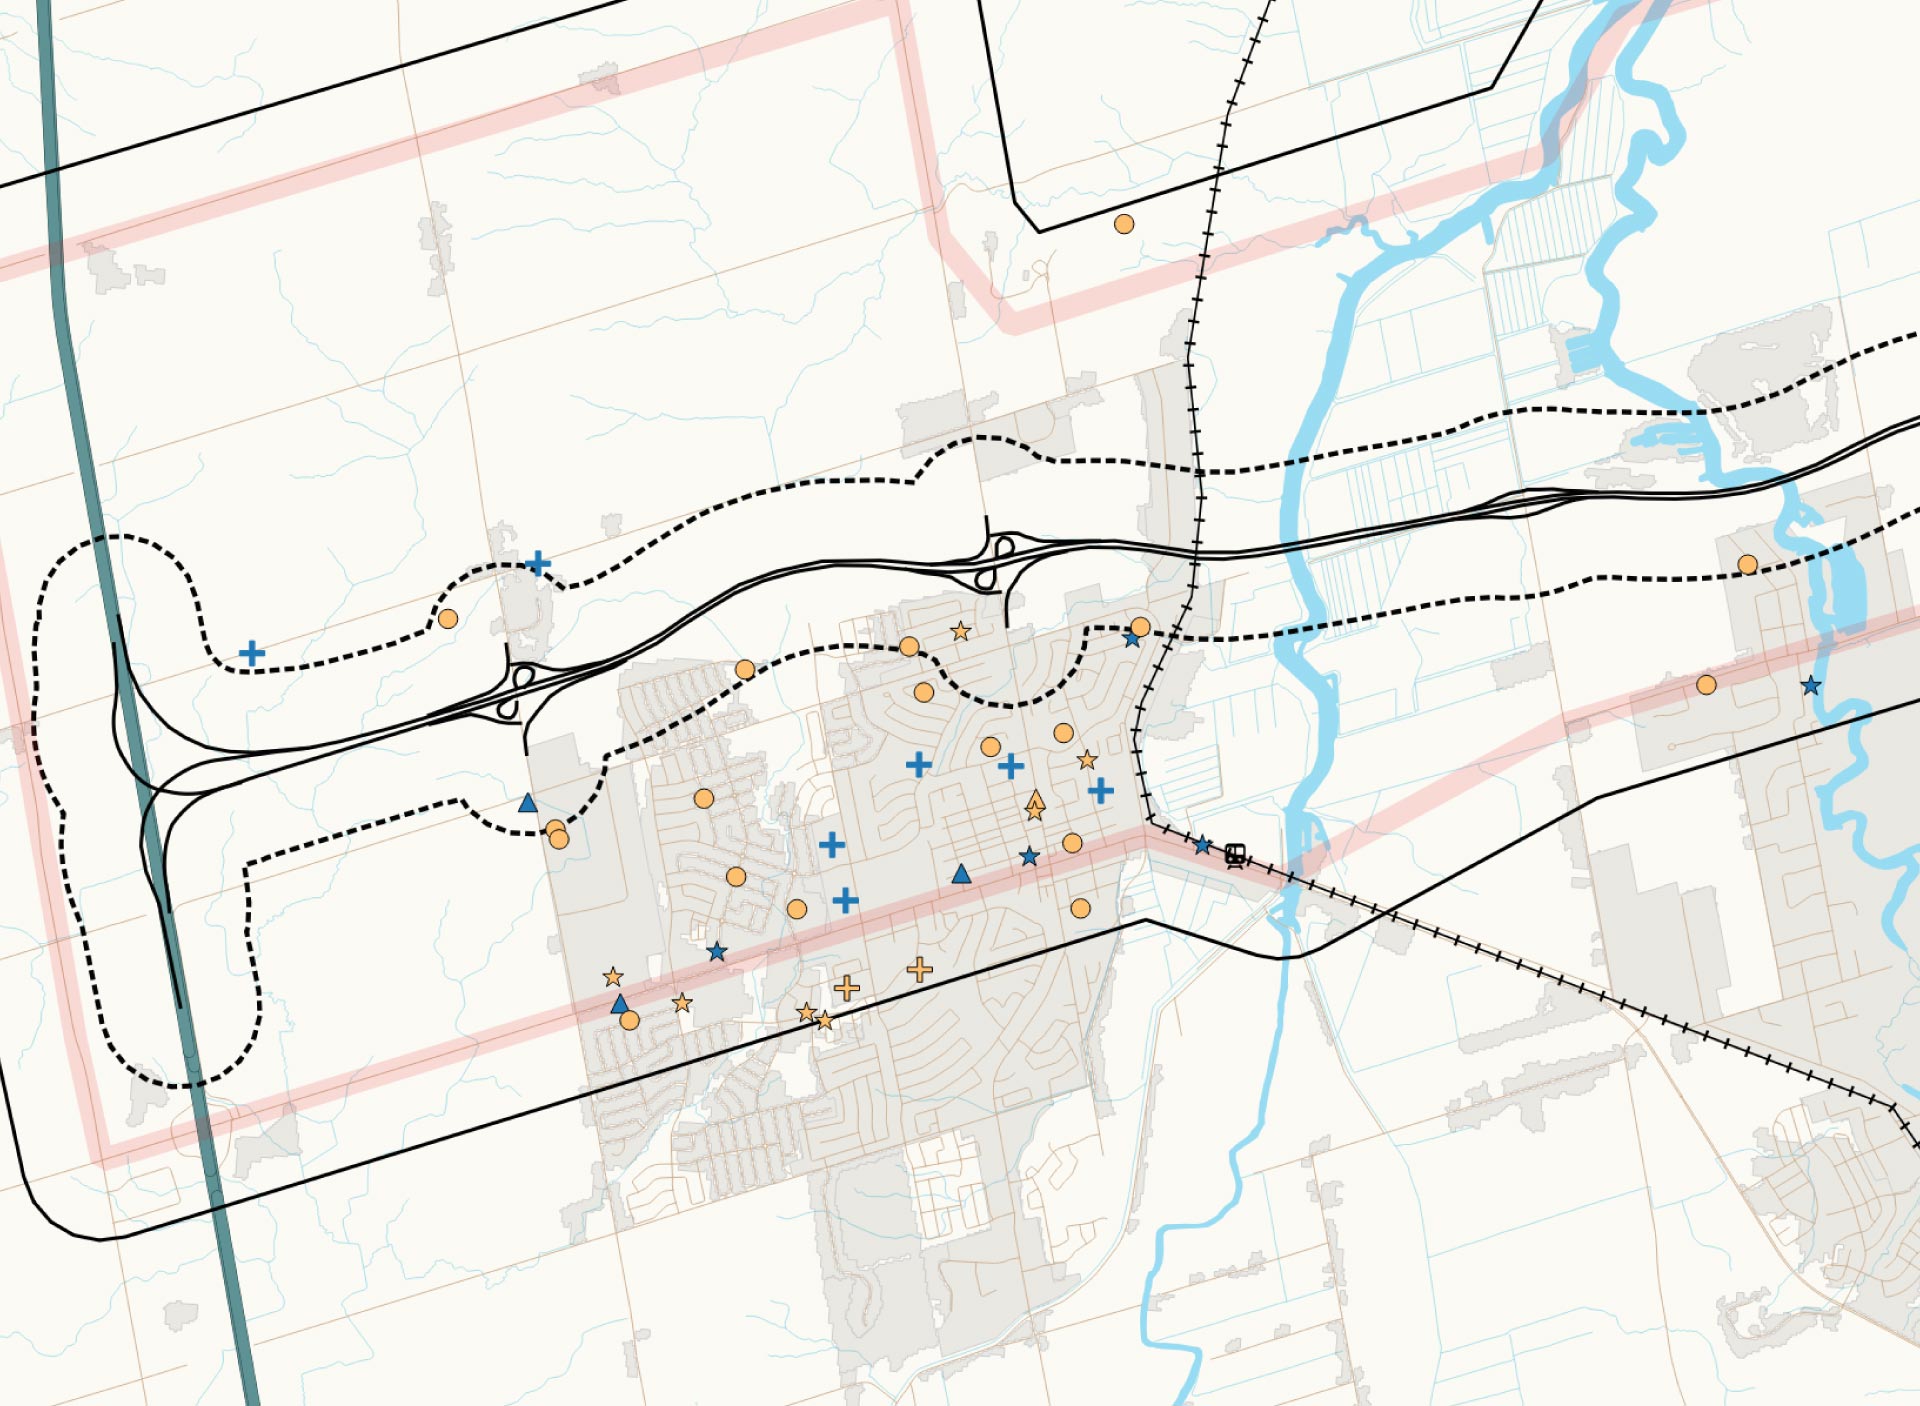
Henderson Memorial Park, located at Line 9 and Sideroad 10, is a recreational facility that includes a playground, splash pad, sports fields, tennis and basketball courts, and more.
This facility is a prime example of what we believe should be included in the MTOs Critical Receptor air quality mapping, but which is not.
Bradford Children's Academy offers daycare for infants and children, as well as before and after school care for children up to 10 years old.
Holy Trinity Catholic High School has several hundred students, and is one of two secondary schools in Bradford.
Lions Park is one of the most popular public parks in Bradford, with a ball diamonds, outdoor ice rink, basketball and tennis courts, splash pad, and playground.
Numerous public parks like this, where people, including young children, spend significant amounts of time outdoors were not included in the critical receptor research by MTO and AECON on the impacts of poor air quality resulting from construction of the Bradford Bypass highway.
Traffic Related Air Pollution (TRAP) Map
This map shows areas where that risk may be most profound along the proposed route, though there are caveats that should be understood that may increase the severity of risk.
There are two key elements to the map, dispersal zones indicating the extent at which identified TRAPs are reduced to background levels, and an illustration of Critical Receptor locations identified in our Critical Receptor Map.
Mapping showing where critical receptors for air quality impacts were identified by the MTO and AECON, as well as additional locations identified by research conducted independently by SCGC.
This research discovered an additional 28 locations where degraded air quality due to highway traffic could have an out-sized impact on the health of children and other residents.
Click the map to view a larger size.
As with the identification of Critical Receptor locations on the previous map, this map includes locations where people, including children, spend time outdoors, including, in particular, engaged in strenuous activity like sports.
By combining proximity to each other, as well as to the dispersal zones of pollutants, a heatmap is generated to show where exposure is likely to be most severe. While those living within the darker red areas are more likely to be exposed to TRAP, this does not account for more fluid dynamics of weather patterns, which may alter how pollutants are dispersed.
Another caveat is, while the severity of exposure tends to increase with closer proximity to the highway, ultra-fine particulate matter (UFP) is generally dispersed more broadly than larger size particulate matter. UFP is particularly concerning with regard to its impact on health as it is able to easily translocate within the body, passing through tissue and into organs, including the brain.
As a result, a person may experience a high severity of exposure at distance from the highway, somewhat in contradiction to the closer, proximity based, modelling that the heatmap indicates here.
MTO's Future Modelling Based on Faulty Assumptions
The ECR notes that “there are anticipated improvements in vehicles combustion efficiency, with older models retired from the vehicle fleet. Therefore, the expected impact from emissions in 2051 and 2061 should result in greater reductions than present for in the 2041 scenario.”3ECR June, 2023. Page 345
There are two points that need to be made with respect to this.
False Choice Dilemma
First, this argument, as with the entire approval process for this project, comes very close to exemplifying a false dichotomy in the sense that, almost exclusively, the choices are presented as either build a highway to solve an increase in traffic, or don’t build a highway and suffer the consequences of congestion due to increased traffic.
The air quality modelling, and associated assumptions regarding emissions, only hold if a highway is seen as the only solution to enabling transportation in the Bradford area.
Alternatives, such as stronger policy direction in support of complete communities, along with investment in establishing efficient regional and inter-regional transit, ideally with electrified rail, would accomplish transportation objectives, and improve the quality of life in our communities at a cheaper cost and with less emissions than the old build more roads and highways approach.
While there is a nod towards a “no-build” scenario, this is discounted due to an absence of traffic modelling for the projected time horizon.
From our perspective this betrays a lack of interest in finding answers regarding what the impact of this project may be on the health of those living nearby.
Relatively simple modelling can be done based on available population and uptake of either personal vehicles, whether ICE or EV, or uptake of mass- and active-transit options, such as what would be available with a commitment to building 15-minute communities and inter-city rail.
Ignoring, or Unaware of, the Research?
The second point addresses the claim that improvements in combustion efficiency will result in emissions reductions. A similar claim is made by oil companies operating in Alberta’s tar sands, and is effectively an intensity based argument.
The math here only works to the extent that the number of vehicles, or the number of barrels of oil, remains the same.
Aggregate emissions may be reduced in this case, but if the number of vehicles grows, which is the business case for building this highway in the first place, then the aggregate amount of emissions also grows.
A reliance on the transition from Internal Combustion Engines (ICE) to Electric Vehicles (EVs) is implied in this argument as well, and it also needs to be addressed because there is a lot of misinformation regarding how EVs impact the environment.
Even with a reduction in the number of vehicles travelling over this route, which is highly unlikely to the case since the case for building it in the first place is a projected increase in vehicle use, it is likely that UFP emissions will increase.
Electric vehicles, due to their increased weight, cause far higher amounts of UFP to be dispersed into the environment than lighter vehicles, and than tail pipe emissions from an equivalent amount of ICE vehicles.
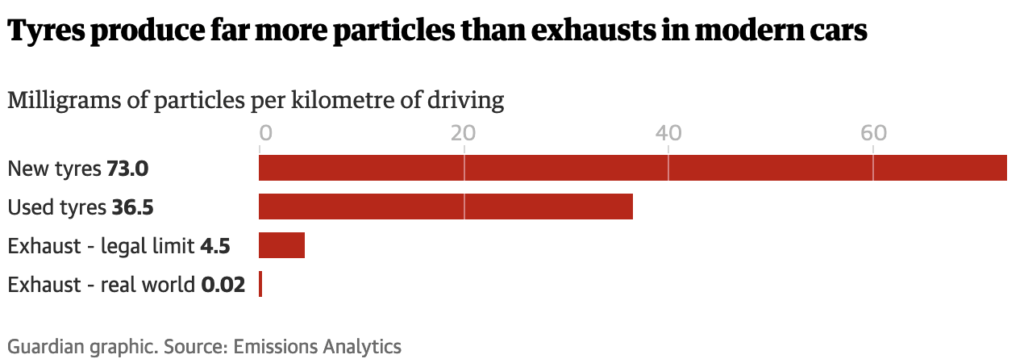
This graph, from The Guardian, shows how much particulate matter tires produce relative to tailpipe exhaust.
Source: Car tyres produce vastly more particle pollution than exhausts, tests show
Much of the UFP comes from the friction between the tire and the road, with particulate, in effect, being rubbed off the tire and cast into the air. There is also evidence particulate matter from tires is a major source of micro-plastics that are increasingly polluting waterways.
Brake dust is another concern, though evidence is somewhat mixed whether this will increase with EVs, which utilize regenerative braking and so don’t engage brake discs as often.
The MTO/AECOM seem to have either simply ignored these findings, or to be unaware of them. Neither of these positions is acceptable given the public health implications.
A Public Health Approach
The myth that more people means more cars and traffic needs to be dispelled. More people in fact generate the opportunity for more efficient and accessible transit options. All that is needed for this to happen is sound policy and political will.
One of the best choices local governments can make to combat climate change is to increase the density of their communities and move people away from cars and towards active and public transportation.
Pursuing this approach not only improves public health outcomes through more active lifestyles, it also solves the tension that arises when the increase in population drives an increased demand for road infrastructure, which in turn negatively impacts the health of residents.
It is increasingly clear that policies that promote increased vehicle traffic should be seen as a last resort, and implemented only where no other options are possible.
Related Content

The Bradford Bypass – Clearing the Air
There are a lot of misconceptions, myths, and misunderstandings regarding the role that highways and cars play in our economy, and the impact they have on our environment and communities. Many of these are coming to the fore with the Bradford Bypass. Here we address some of them.

Bradford Bypass
The provincial government is proposing a highway that would connect the 404 with the 400. The proposed route passes along the northern edge of Bradford, and through portions of the Holland Marsh.

Ontario’s new highways, with guest Laura Bowman of Ecojustice
On this episode of the Tree Planters Podcast we talk with Laura Bowman, of Ecojustice, about the province’s plans to build new highways in the Greater Toronto Area (GTA).
Community supported, advocacy for a safe and secure future.
Governments have failed to act to protect our communities and the futures of our children and grandchildren, and they continue to treat our environment as if it’s incidental to life, rather than a foundation for it.
We need strong community organizations to fight for our future, now more than ever.
Please consider donating to support our work. It’s people like you who make us possible.
Subscribe to Our Newsletter
We send out a once-monthly newsletter full of information on what’s happening in Simcoe County and beyond, including information on how you can take action to protect the health of your community.

