Aggregate Mining in the Greenbelt
New research released by Gravel Watch Ontario, Simcoe County Greenbelt Coalition and Environmental Defence suggest that massive amounts of aggregates for the Bradford Bypass and 413 highways will come from pits in the 905 and the Greenbelt.
Mining these aggregates will have serious impacts on nearby communities and must be addressed in environmental reviews of the proposed highways.
According to the research, building the two highways will require approximately 3 million tonnes of new aggregate, and will increase truck traffic within affected communities by over 130,000 truckloads during construction.
The analysis shows that several communities within the 905 region are more at risk of becoming the future source of the highways’ aggregate because of their proximity to the proposed routes of the highways, the amount of potential aggregate resources available, and concentration of existing permits within particular areas.
Highlights
- A total of 288 square kilometers within the study area is dedicated to active aggregate pits;
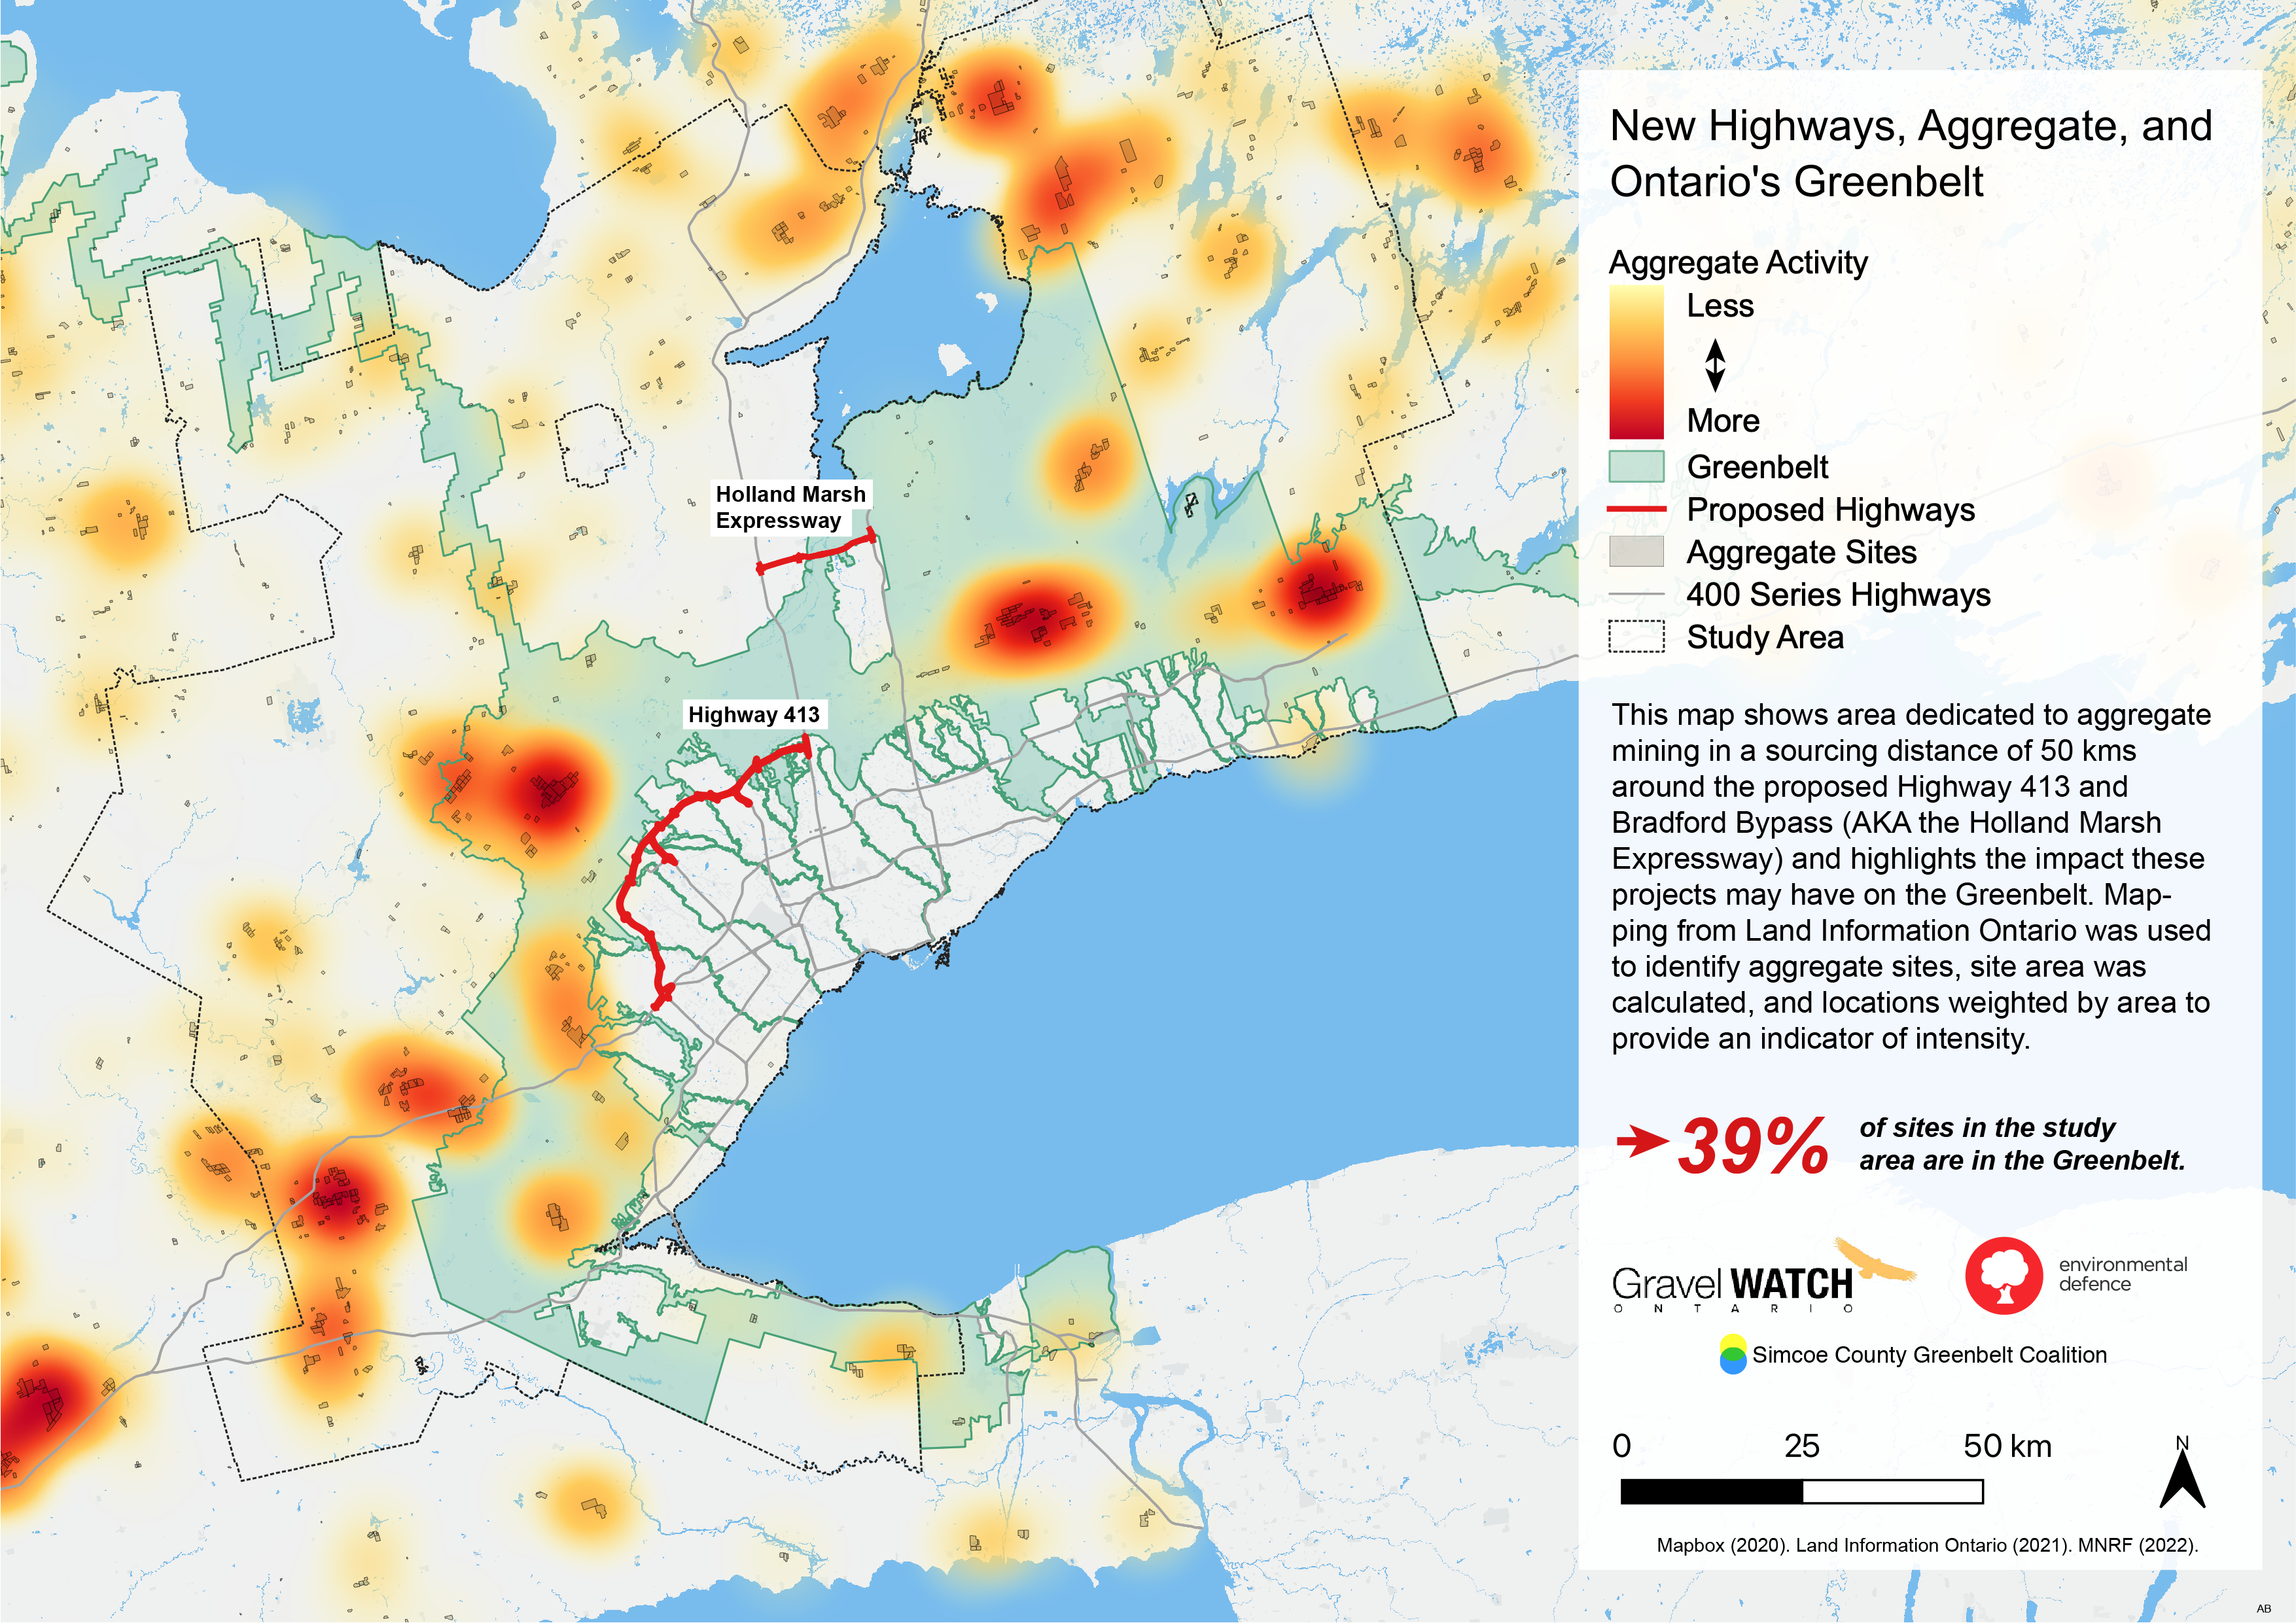
- 39% of aggregate sites within the study area are found within the Greenbelt’s boundaries, while the Greenbelt covers only 29% of the study area;
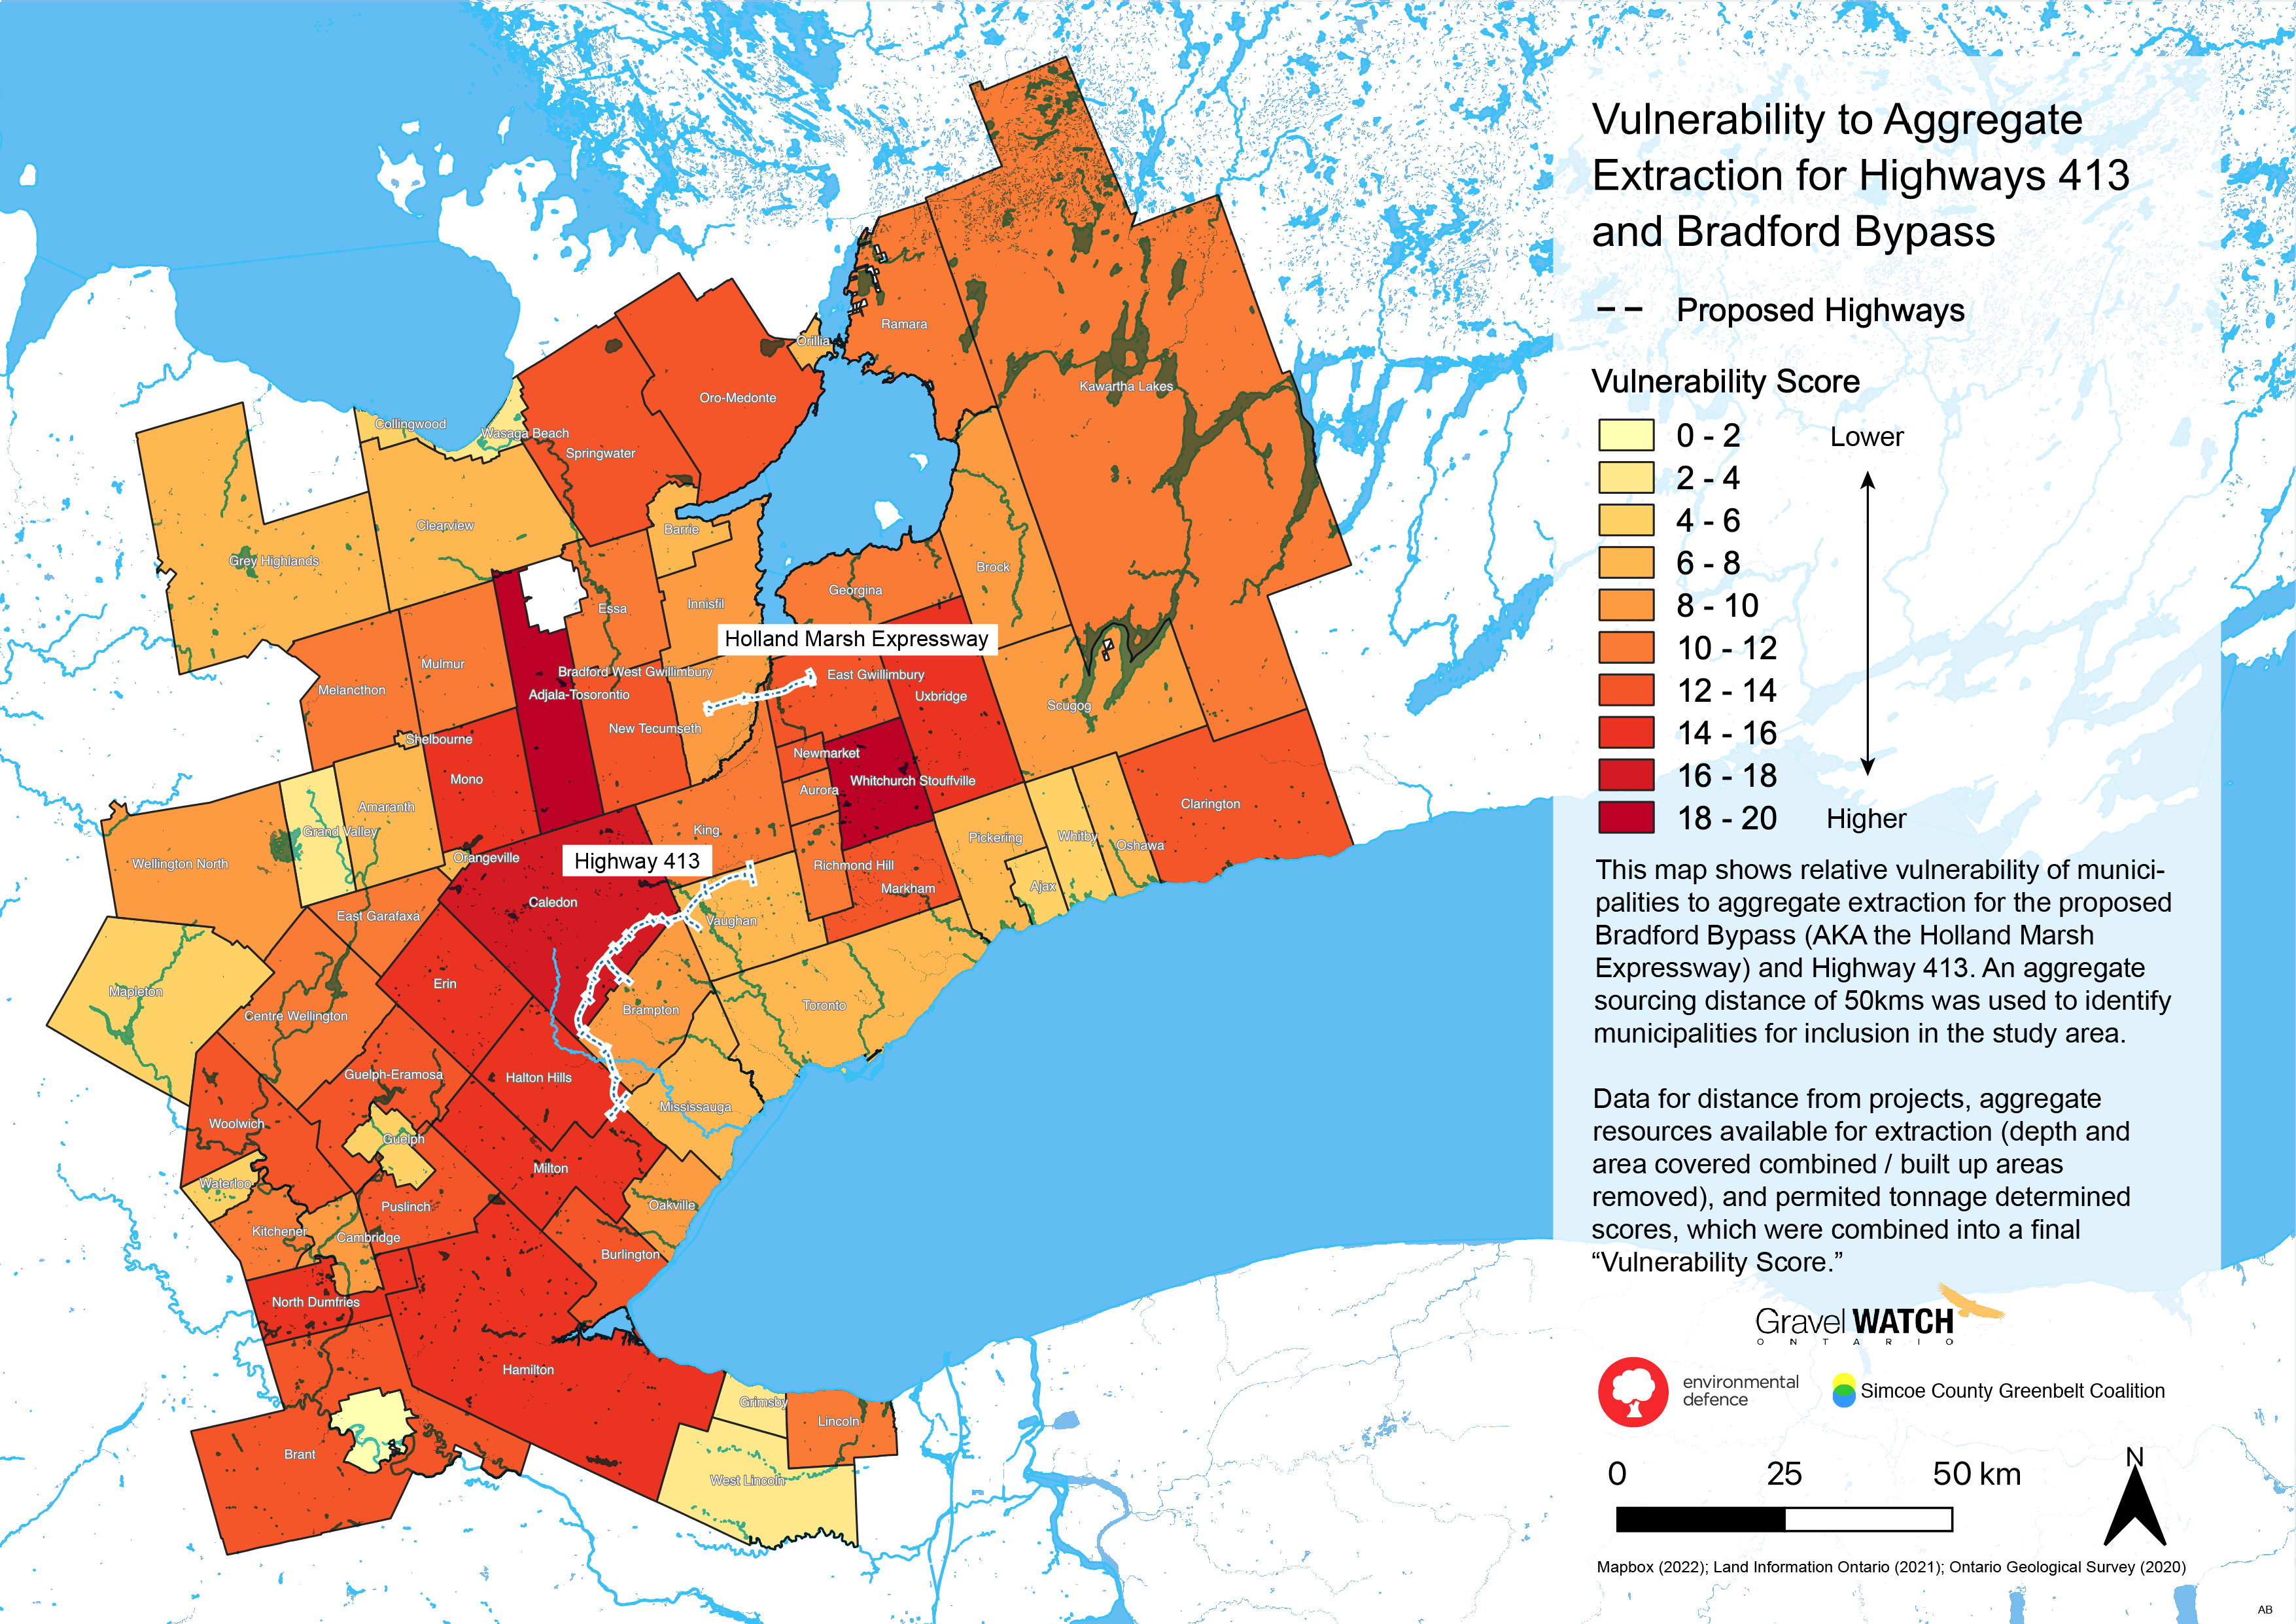
- Caledon, Adjala-Tosorontio, and Whitchurch-Stouffville, are likely to be impacted by aggregate demands for these projects the most;
- Unrehabilitated site data from the government is unreliable, with record dates limited to a time between 2006 and 2010. Viewing sites with satellite imagery show a use-mix of what look like former aggregate pits, agricultural lands, and residential areas;
- Furthermore, some sites overlap with each other.
Map: Municipal Vulnerability to Aggregate Activity for New Highway Construction in the GTA
This choropleth map is segmented by municipality, and weighted according to a scoring system that combines four scores:
- “PER_SCORE”, which is the percent of the municipality’s area covered by sand and gravel resources, excluding built up areas;
- “DIST_SCORE”, which is a measure of the distance that the municipality is from the respective projects;
- “TON_SCORE”, which is a measure of the total tonnage allowed in the municipality;
- and “DEP_SCORE”, which is a measure of the depths of the sand and gravel resources contained within the municipality.
PER_SCORE
For the PER_SCORE the sand and gravel mapping, which were separate files, were combined, the built up areas in the municipality were then subtracted from the combined file, and the result was then measured as a percent of the total area of the municipality. Scores are from 1 to 4, representing 25% increments.
DIST_SCORE
The distance scores are derived from the 20 kilometre and the 50 kilometre distances from the proposed projects. The 50 kilometer radius from the projects is based on a conservative estimate, provided by Gravel Watch Ontario, of the distance from which aggregate resources are normally sourced for projects, with that distance sometimes being expanded outward to 70 kilometers. A score of 2 was given if the municipality was within the 20 kms radius, and 1 if it was within the 50 kms radius. For municipalities within the 20 km radii of both projects a total of 4 was given, and likewise, if a municipality was within the 20 km radius of one project and the 5 km radius of another, it got a score of 3.
TON_SCORE
The tonnage score is based on a decile, with municipalities receiving a score of between 1 and 10, where 10 represents the highest total tonnage permitted within the municipality.
DEP_SCORE
A depth score of aggregate resources based on mapping by the Ontario Geological Survey (OGS) was included to give an additional metric of impact. Depth data are provided by OGS in four categories: Less than 1.5m; 1.5m to 3m; 3m to 6m; and Greater than 6m. DEP_SCORES were apportioned from 1 to 4, with 1 for 1.5m and 4 for Great than 6m.
Sources
“Aggregate site authorized – active”, Land Information Ontario. Info updated November 16, 2018. Data updated December 15, 2021. Downloaded November 25, 2021. (Link)(Data)
Aggregate Resources of Ontario—2020”,Ontario Geological Survey. Downloaded June 30, 2021. (Link)
“Greenbelt outer boundary”, Land Information Ontario. Info updated August 6, 2021. Data updated May 18, 2017. Downloaded January 2, 2022. (Link)
“Mapbox Base Monochrome”, Mapbox (personal account). Created January 10, 2022. Accessed January 11, 2022. (Link)
“Ontario Road Network (ORN) Road Net Element”, Ontario Ministry of Natural Resources and Forestry. Info updated September 27, 2019. Data updated January 5, 2022. (Link)
“GTA_West_RevisedRoute_August2020_Lat_Lon”, Environmental Defence/As The Crow Flies Cartography. Received November 30, 2021.
“Municipal Boundary – Lower and Single Tier”, Land Information Ontario. Info updated June 4, 2019. Data updated April 20, 2021. (Link)
Bryan Smith, of Gravel Watch Ontario, has been long involved with local aggregate issues and knows what kind of burden this will place on the rural communities that could be affected.
“These highway proposals are being touted as a net benefit, but the communities where the pits and quarries would make a Swiss cheese of the landscape will not feel the same. From increased truck traffic, wear and tear on local roads, reduced air quality, to issues with groundwater, aggregate comes at a high cost to the host municipality and its residents. There is no net benefit. Consequently, many municipalities are asking the province to make aggregate pay their fair share.”
The rock, sand and gravel extraction and its impact on communities up to 50 kilometers from the proposed routes is just another example of how the province is pushing forward these highway proposals without a full examination of their costs and impacts.
Map: Aggregate Mining in Ontario's Greenbelt
The “Aggregate Site Heatmap” is meant to show clustering of aggregate sites. This map uses one source of information shown two different ways – a heatmap, which draws attention to the density of sites, and the sites themselves, shown as polygons.
The heatmap uses data from the “Aggregate site authorized – active” file provided by the provincial government, with the sites, which are provided in polygon form, converted into centroid points. The size of the polygons is calculated into “AREA” and the centroid points are weighted by this metric.
The Greenbelt boundary is included to indicate impacts that aggregate mining may have on an area many Ontarians believe is protected from development, as well as industrial, activity. While development, understood in a strict sense of housing, may be restricted, the knock on effects of road and highway construction, this data shows, are largely not.
A measure of aggregate impact on the Greenbelt was arrived at by calculating the surface area of aggregate mines located within the Greenbelt AND within the study area. The result shows that 29% or the study area is covered by Greenbelt and 39% of the surface area of aggregate pits located within the study area are to be found within the Greenbelt boundaries.
Sources“Aggregate site authorized – active”, Land Information Ontario. Info updated November 16, 2018. Data updated December 15, 2021. Downloaded November 25, 2021. (Link)(Data)
“Greenbelt outer boundary”, Land Information Ontario. Info updated August 6, 2021. Data updated May 18, 2017. Downloaded January 2, 2022. (Link)
“Mapbox Base Monochrome”, Mapbox (personal account). Created January 10, 2022. Accessed January 11, 2022. (Link)
Ontario Road Network (ORN) Road Net Element”, Ontario Ministry of Natural Resources and Forestry. Info updated September 27, 2019. Data updated January 5, 2022. (Link)
“GTA_West_RevisedRoute_August2020_Lat_Lon”, Environmental Defence/As The Crow Flies Cartography. Received November 30, 2021.
“Municipal Boundary – Lower and Single Tier”, >Land Information Ontario. Info updated June 4, 2019. Data updated April 20, 2021. (Link)
Tim Gray, Executive Director of Environmental Defence, is concerned that environmental assessments of the highways won’t be considering the impacts from required aggregate.
“The shocking scale of the aggregate needed to build these highways means impacts will be felt by communities across a number of regions. The federal and provincial governments have an obligation to assess and address these widespread impacts as part of a robust and thorough environmental assessment of the highway projects.”
The mapping also shows that nearly 40 per cent of the aggregate sites likely to supply material for these projects are located within the Greenbelt.
Expansion of those pits puts at risk the crucial ecosystem services the Greenbelt provides, such as clean water, fresh air, healthy food, and habitat for wildlife. These impacts of aggregate extraction on the Greenbelt are compounded by the fact that they are being used, in this case, for projects that run through the Greenbelt, and which will likely lead to increased development pressure on it.
Did you know?
Ontario's Greenbelt provides:
$2.1 billion dollars worth of recreational activity each year.
$224 million dollars worth of flood prevention every year.
$52 million equivalent of carbon absorption every year.
Margaret Prophet, Executive Director of the Simcoe County Greenbelt Coalition, believes that the highway proposals are yet another example of how this government has targeted the Greenbelt on behalf of developers.
“We heard promises that “we’re not going to touch the Greenbelt,” and yet this government wants to run two large highways right through it. The demand for aggregate, and the fact that much of it is likely to come from within the Greenbelt, only makes matters worse. The narrow focus on localized impacts creates a situation in which the Greenbelt is left vulnerable to a death by a thousand cuts. The impact of aggregate mining for these highways is a perfect example of this.”
The coalition’s research shows there is little that municipalities can do to protect citizens and ensure a healthy environment in the face of pressure from the aggregate industry.
Tim Gray adds, “The province is knowingly putting communities and the Greenbelt at risk from increased aggregate extraction to build destructive and unnecessary highways. And thanks to recently passed legislation, they have removed almost every tool municipalities used to have to limit or control these impacts. The communities located in these extraction hotspots need to be aware that if these highways go ahead it will impact them, even if they are far from the highways’ routes.”
Related Content

Getting To Know Us: Protecting the Environment
The environmental benefits of smarter planning are considerable, and can form a key plank in addressing climate change and ensuring healthy communities for all.

New Highways and Aggregate Mining in the Greenbelt
Research by Gravel Watch Ontario, Simcoe County Greenbelt Coalition and Environmental Defence suggests aggregates needed for the Bradford Bypass and 413 highways will come from the 905 and the Greenbelt.

The Bradford Bypass – Clearing the Air
There are a lot of misconceptions, myths, and misunderstandings regarding the role that highways and cars play in our economy, and the impact they have on our environment and communities. Many of these are coming to the fore with the Bradford Bypass. Here we address some of them.


